Key takeaways
- Above 0, buyers lead. Below 0, sellers lead. Between -2 and +2 the market is balanced.
- Beyond the saturation level (±8 by default) the move is stretched: stop chasing. It does not say when the move will turn.
- The built-in table shows the reading on 30m, 1H, 4H and 1D, so you can check the bigger picture without switching charts.
- Shrinking columns and a triangle marker mean the push is easing off.
- Trend Core measures strength; it has no entry labels. Pair it with Trend Confirmation.
Overview
Whip Trend Core tells you how strong the current trend really is. Where Whip Trend Confirmation shows you when the trend flips, Trend Core shows you how much pressure is behind it: whether buyers or sellers are in control, whether that control is building or fading, and whether a move has gone so far that it is due to cool off.
Its readings mean the same thing on every market and timeframe, so you can read Bitcoin, EUR/USD, gold or a stock with the same levels.
Use it to answer three questions before you act on a signal:
- Who is in control? Bulls or bears, and by how much.
- Is the pressure growing or fading? A strengthening trend or one running out of steam.
- Is the move stretched? Normal, strong, or saturated and ready to turn.
Trend Core sits in its own panel below the price chart. It works on crypto, forex, indices, stocks and commodities, and is built to be read alongside Whip Trend Confirmation.
Why traders use it:
- One number tells the story. Above 0, buyers are winning. Below 0, sellers are. Beyond the saturation level (±8 by default), the move is stretched.
- Warns before the turn. Saturated readings and fading columns often show up before the price turns, so you can protect profits instead of giving them back.
- Stops you chasing. A late signal into a stretched move is easy to spot and easy to skip.
- Same levels everywhere. The same readings apply on every market and timeframe.
- Every timeframe at a glance. A built-in table shows the reading on 30m, 1H, 4H and 1D, so you can check the bigger picture without switching charts.
- Alerts built in. Six preset alerts cover control changes, saturation, and saturation easing off.
- Works out of the box. The defaults suit every market. Presets and an Auto mode are there if you want saturation tuned to yours.
What's new in Trend Core
Trend Core has been updated. The readings work exactly as before, with these additions:
| New | What it does |
|---|---|
| Multi-timeframe table | Shows the Trend reading, bull and bear pressure, and a plain-English state for 30m, 1H, 4H and 1D, in the corner of the panel. |
| Saturation level (default 8) | Dotted lines mark the saturation level above and below 0. Readings beyond them are saturated. |
| Saturation presets and Auto | Pick a level tuned for crypto, gold and metals, forex or indices, or let Auto set it from how your chart normally moves. |
| Saturation bands | The panel background shades while the reading is saturated, so stretched stretches stand out. |
| Triangle markers | A triangle prints when a saturated move starts to ease: buyers or sellers backing off. |
| Six preset alerts | Control shifting to buyers or sellers, bullish or bearish saturation, and saturation easing off. |
| New colors | Buying pressure is purple and selling pressure is black. |
The walkthrough charts further down this guide were captured before the color update, so on them the buying columns appear green and the selling columns red. The readings and levels are read the same way.
What you see in the panel
| Element | What it tells you |
|---|---|
| Purple line and shading (upper half) | Bull pressure. The higher it climbs, the more control buyers have. |
| Black line and shading (lower half) | Bear pressure. The deeper it drops, the more control sellers have. |
| Black Trend line | The net result of the two. Above 0, buyers are winning. Below 0, sellers are winning. This is the main reading. |
| 0 line | The balance point between bulls and bears. |
| +2 and -2 lines | The edges of the balanced zone. Readings beyond them mean one side is clearly in charge. |
| Light band between +2 and -2 | The balanced zone, where neither side has a clear edge. |
| Purple columns (above 0) | Buying columns. Buyers are pushing hard right now. Taller columns mean a stronger push. |
| Black columns (below 0) | Selling columns. Sellers are pushing hard right now. Deeper columns mean a stronger push. |
| Dotted lines above and below | The saturation level (±8 by default). Readings beyond them are saturated. |
| Grey background band | The reading is saturated. The band ends when the move eases back inside the level. |
| Triangle | A saturated move has started to ease. A triangle pointing down near the top means buyers are backing off; pointing up near the bottom means sellers are. |
| Table in the corner | The reading on your other timeframes. See Reading the timeframe table. |
The right-hand scale shows the live values for each element.
The columns are the quickest thing to scan. A run of buying columns shows buyers in control; a run of selling columns shows sellers taking over. When the columns shrink and stop printing, that push is fading.
| TF | Trend | State |
|---|---|---|
| 30m | -3.1 | Sellers in control |
| 1H | 2.4 | Buyers in control |
| 4H | 9.2 | Saturated (buyers) |
| 1D | 1.1 | Balanced |
Reading the values
Most of the time the Trend line moves between -2 and +2. What matters is where it sits, which way it is heading, and how far it has stretched.
| Trend line reading | What it means | How to treat it |
|---|---|---|
| Between -2 and +2 | Balanced. Neither side has a clear edge. The trend is forming or changing. | Expect chop. Wait for a clear break or a signal from Trend Confirmation. |
| Above +2 and rising | Buyers in control and gaining. | Favor buys. Sell signals here are more likely to be pullbacks. |
| Below -2 and falling | Sellers in control and gaining. | Favor sells. Buy signals here are more likely to be bounces. |
| Above +8 (default level) | Saturated bullish. The up move is stretched. | Do not chase new buys. Protect profits and watch for a SELL on Trend Confirmation. |
| Below -8 (default level) | Saturated bearish. The down move is stretched. | Do not chase new sells. Watch for a BUY on Trend Confirmation. |
Crossing zero. When the Trend line crosses from below 0 to above 0, control has passed from sellers to buyers, and the reverse when it crosses down. It is an early sign of a trend change, not a signal on its own.
Direction matters as much as level. A reading of +3 that is falling is weaker than a reading of +1 that is rising. Watch the slope, not just the number.
Saturation is a warning, not a timer. A saturated reading says a move is stretched, not that it will turn. In our testing, stretched moves in trending markets such as Bitcoin and gold often kept going, while range-bound markets such as EUR/USD pulled back more often. Use Trend Confirmation to see when a flip actually happens.
Divergence. If price makes a new high but the Trend line makes a lower high, the push behind the move is weakening. The same applies in reverse at lows. Divergence often shows up before a flip on Trend Confirmation.
Choosing the saturation level
Saturation starts at ±8 by default. Markets move differently, so you can change where it starts under Settings, then Saturation level mode:
| Mode | Level | Best for |
|---|---|---|
| Fixed level | 8 by default, or any number you set | A single level you choose. A good default on every market. |
| Crypto preset | 10 | Bitcoin and altcoins, which run further before they are truly stretched. |
| Gold & metals preset | 10 | Gold, silver and other metals, which trend hard. |
| Forex preset | 9 | Currency pairs. |
| Indices preset | 12 | NQ, ES, US30 and other indices. |
| Auto (adapts to this chart) | Set from this chart's own history | Any market. It places the level where readings are rare on your chart (roughly the most extreme 6%), kept between 6 and 16. |
Which to pick? Start with the default. If your market is saturated so often that the bands stop meaning anything, use its preset or Auto. If it almost never reaches saturation, lower the fixed level.
The reset buffer. Once a reading is saturated, it has to move back 1 point inside the level (the Saturation reset buffer) before it counts as leaving. That stops the band, the triangles and the alerts flickering when the line hovers around the level.
Reading the timeframe table
The table in the corner of the panel shows Trend Core on other timeframes, so you can see the bigger picture without switching charts.
| Column | What it shows |
|---|---|
| TF | The timeframe. 30m, 1H, 4H and 1D by default. |
| Trend | The Trend reading on that timeframe. |
| Bull and Bear | Bull and bear pressure on that timeframe. Trend is Bull plus Bear. |
| State | Saturated (buyers), Saturated (sellers), Buyers in control (above +2), Sellers in control (below -2), or Balanced. |
Rows above +2 are shaded purple and rows below -2 are shaded dark, so the side in control stands out. By default the table uses each timeframe's last closed candle, so it does not change while a candle is still forming, and timeframes shorter than your chart are hidden.
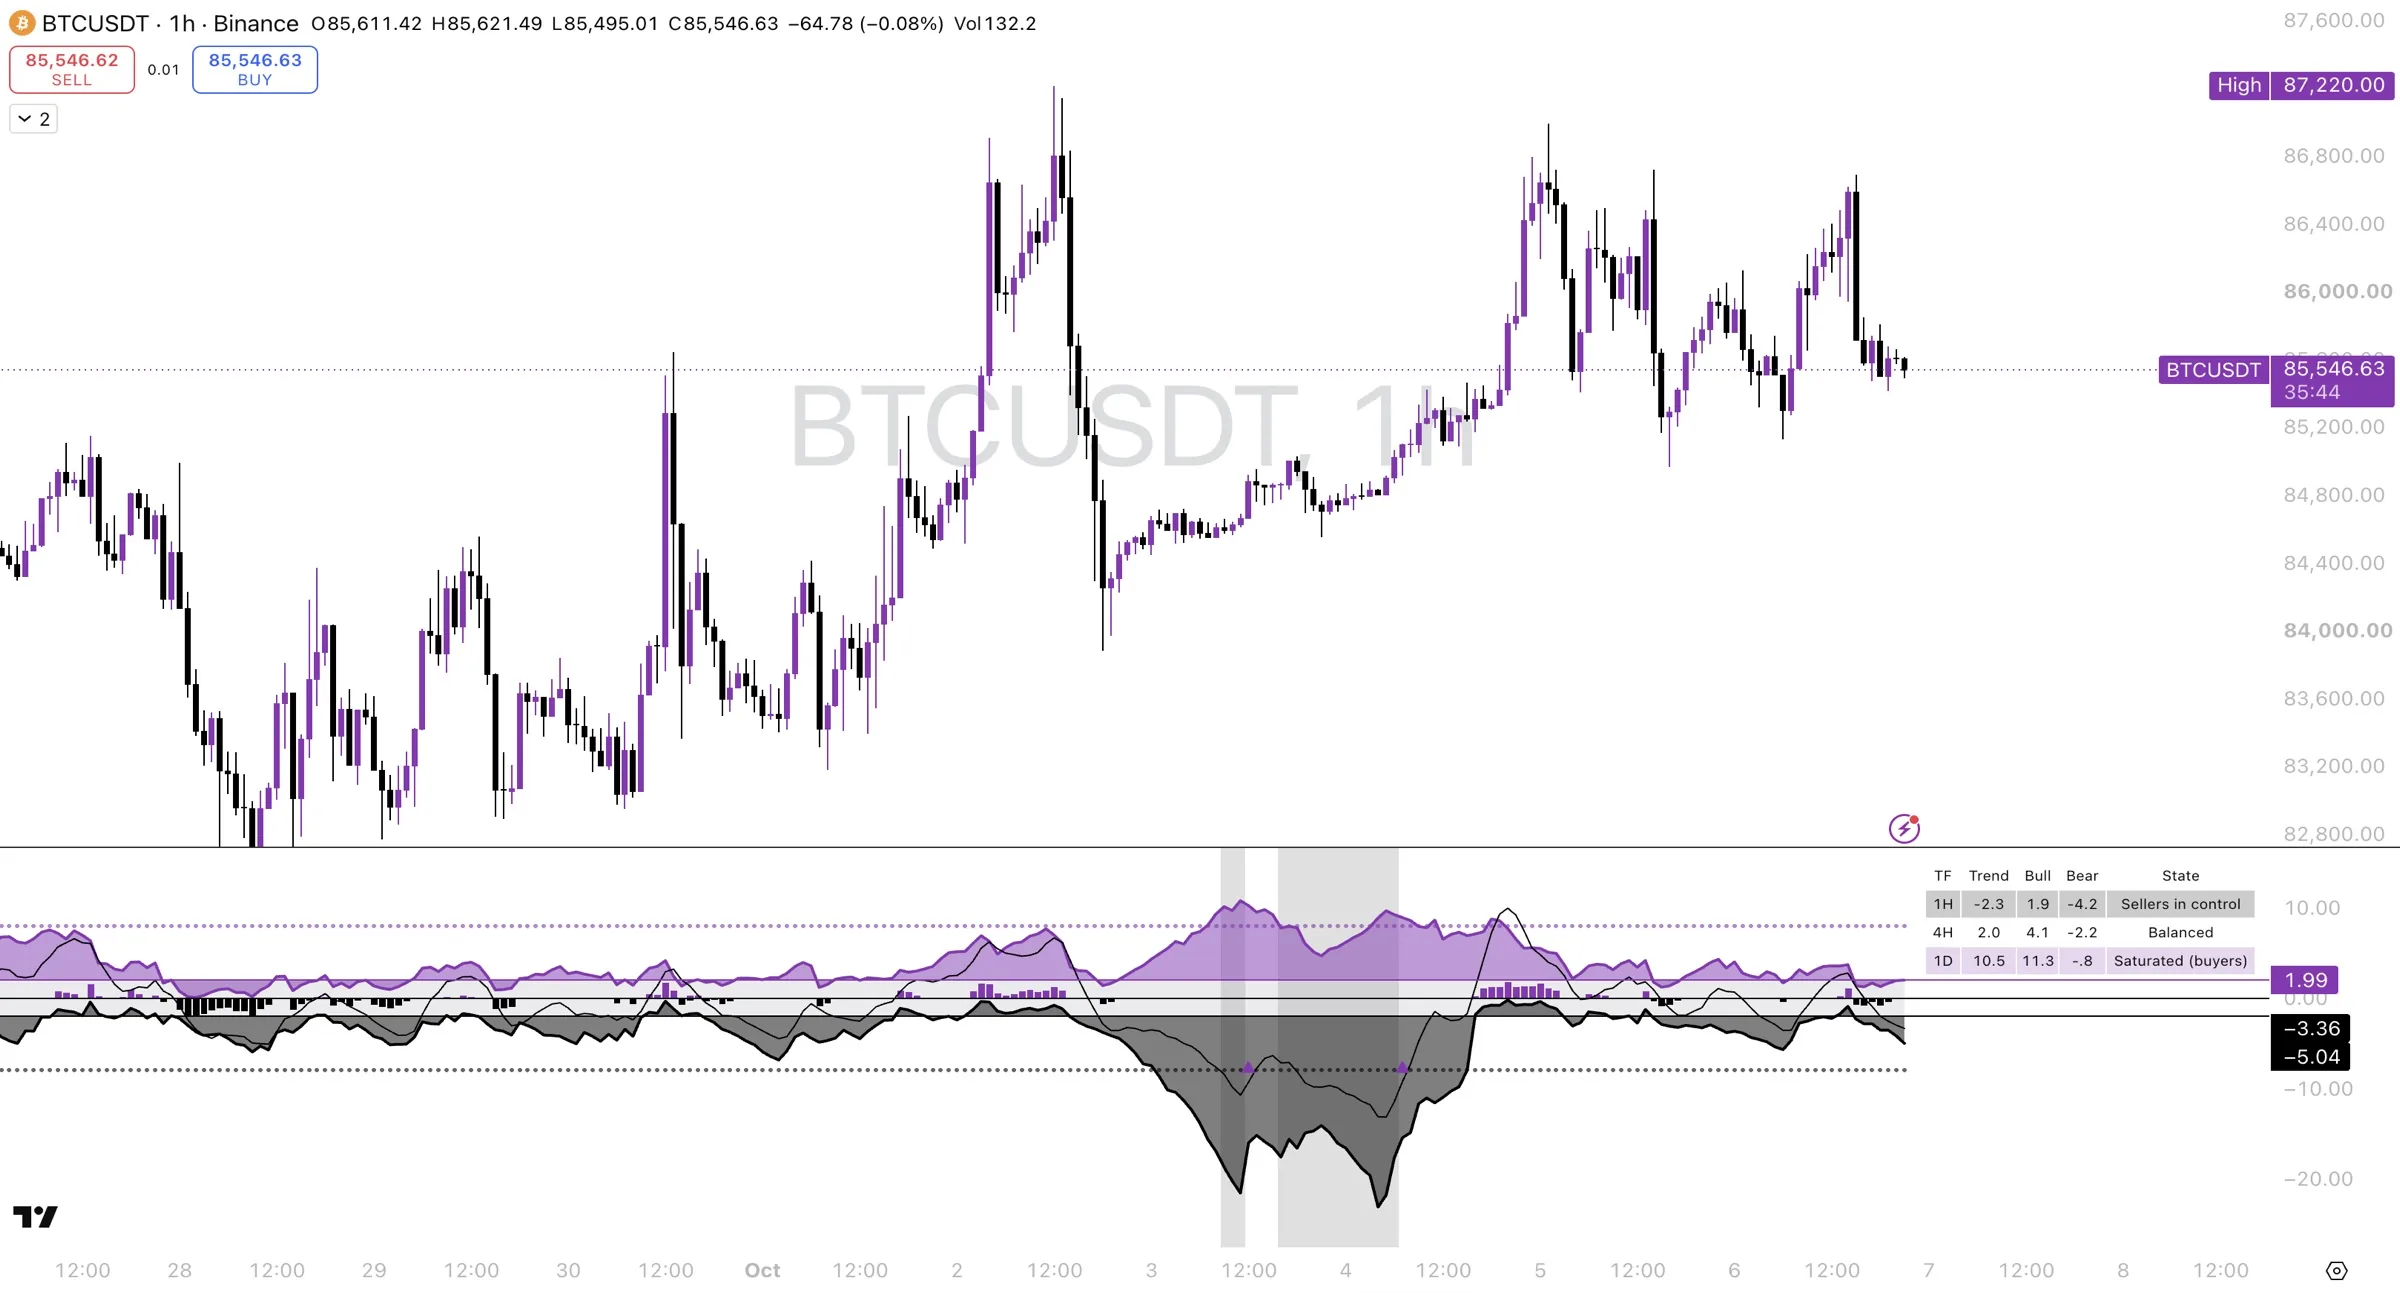
Example from the screenshot. At the right edge of the updated chart, the table reads:
| TF | Trend | State | What it says |
|---|---|---|---|
| 1H | -2.3 | Sellers in control | Short term, sellers have the edge. |
| 4H | 2.0 | Balanced | The medium-term picture is undecided. |
| 1D | 10.5 | Saturated (buyers) | The daily uptrend is stretched. |
Read together: a short-term pullback inside a daily move that is already stretched. That is not a place to chase new buys on the daily, and the 1H selling has not yet turned the bigger picture. The 30m row is hidden because the chart is on 1H. Switch to a 30m chart and it appears.
Saturation bands and triangles on the same chart. After the spike to the 87,220 high on October 2, price fell to near 83,900. On October 3 and 4 the Trend line dropped below the lower dotted line twice, and the grey bands mark those saturated stretches. Each band ends with a triangle where sellers started to ease off. Price then recovered to near 86,900 on October 5. Saturation warned that the selling was stretched; it did not say when the recovery would start, which is why the guide pairs it with the labels on Trend Confirmation.
Reading the example chart
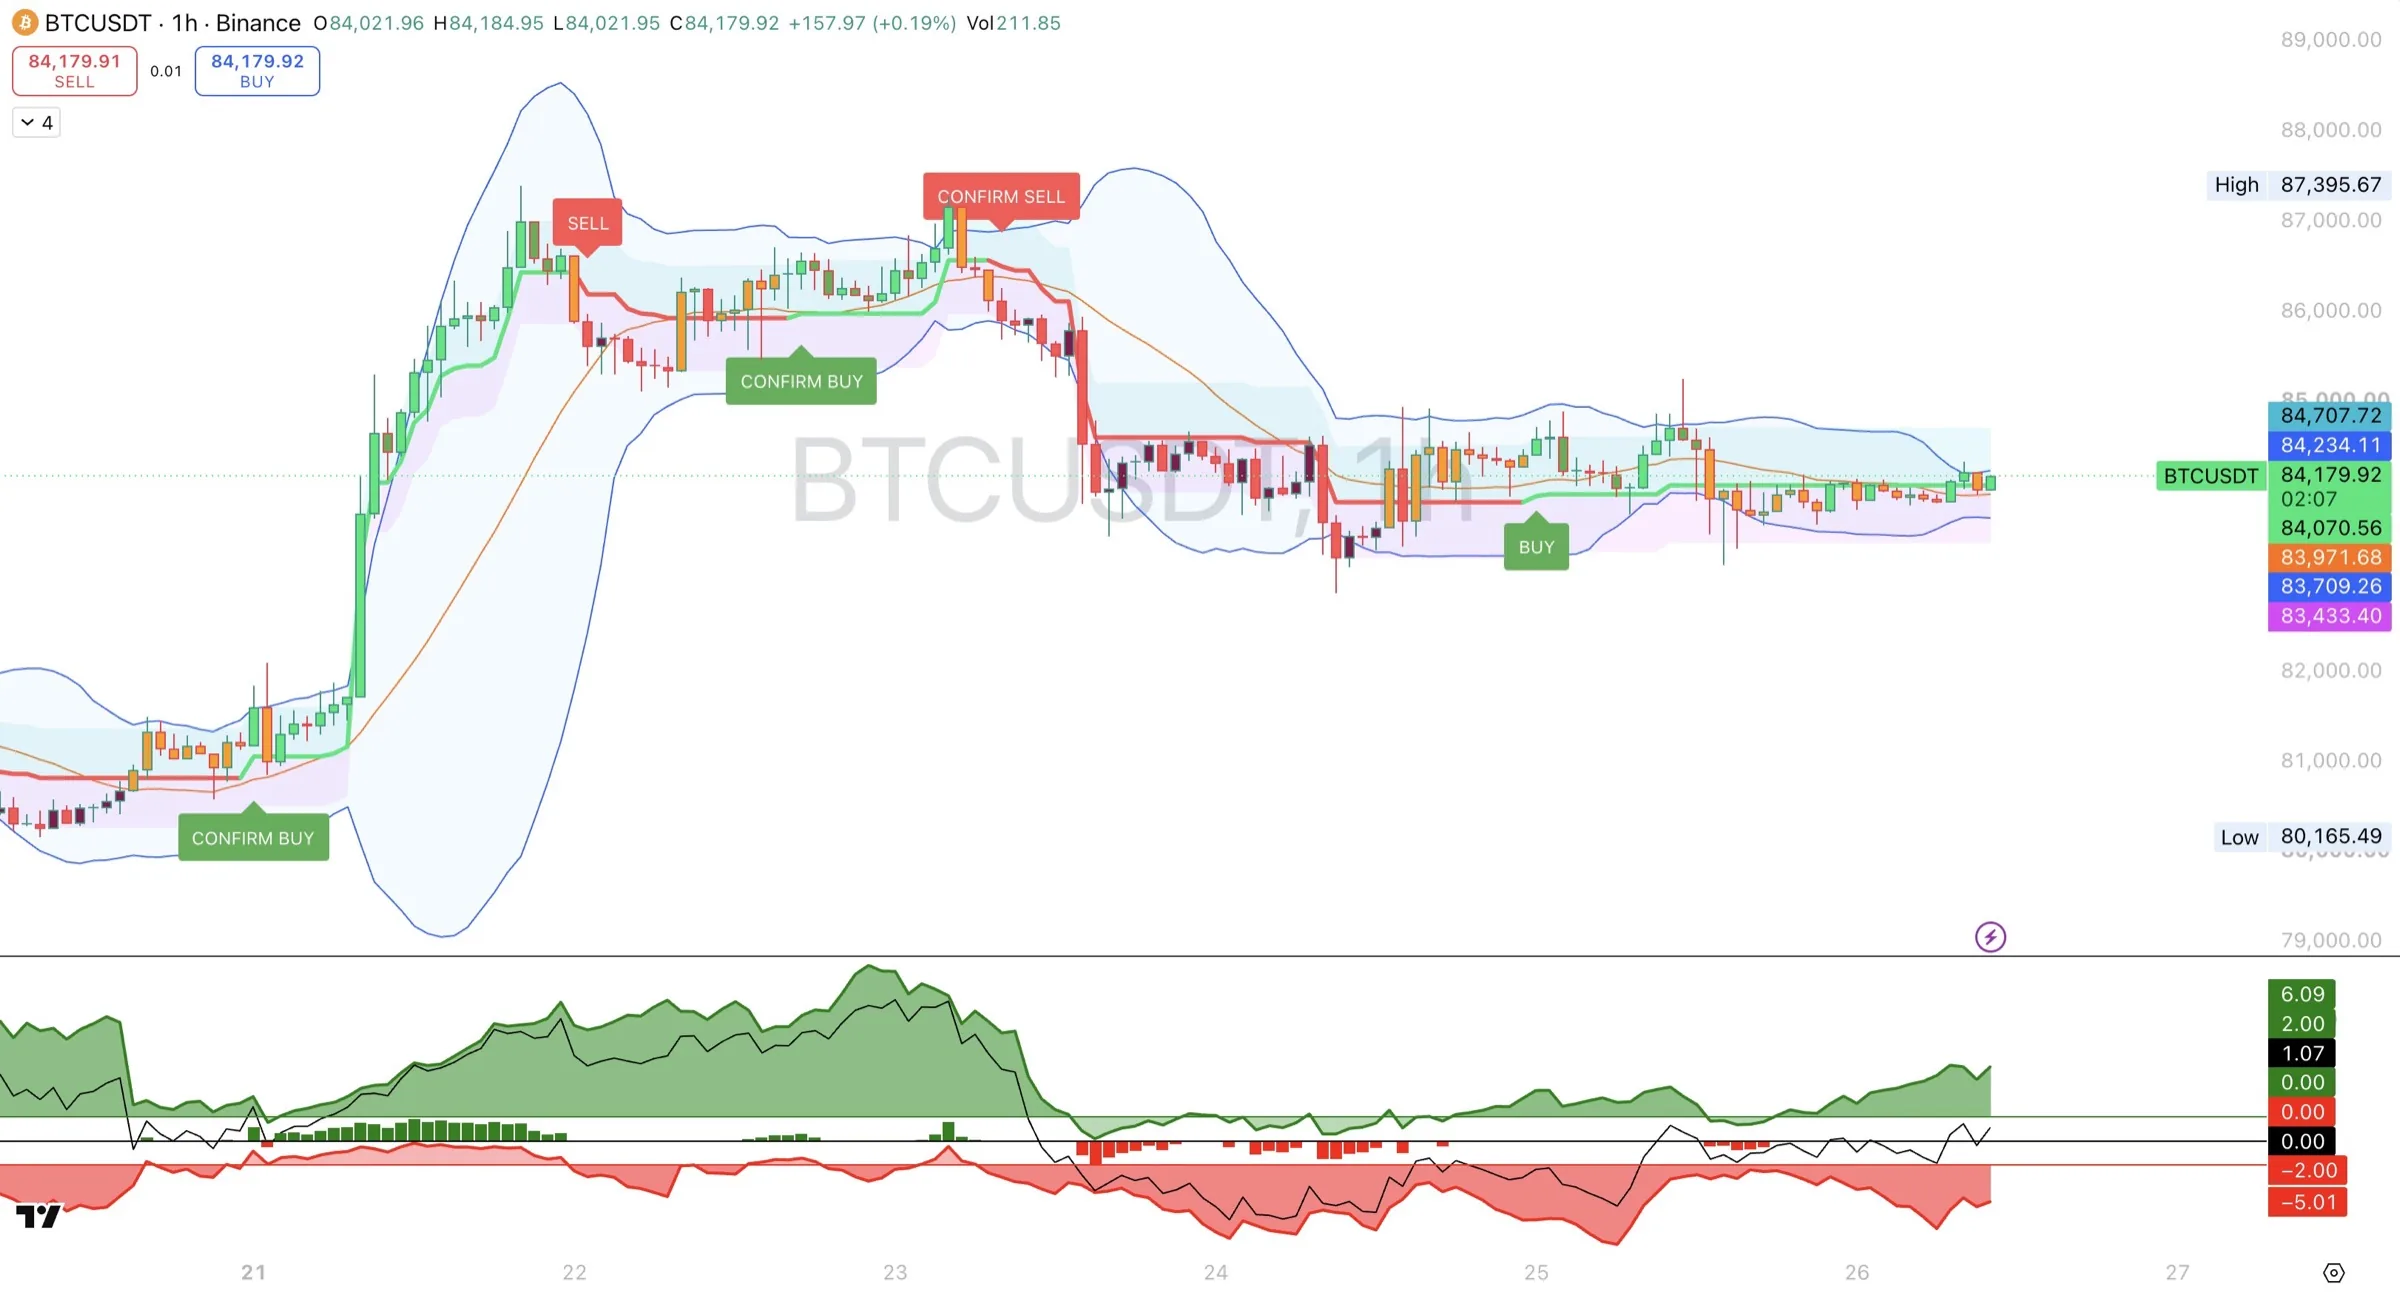
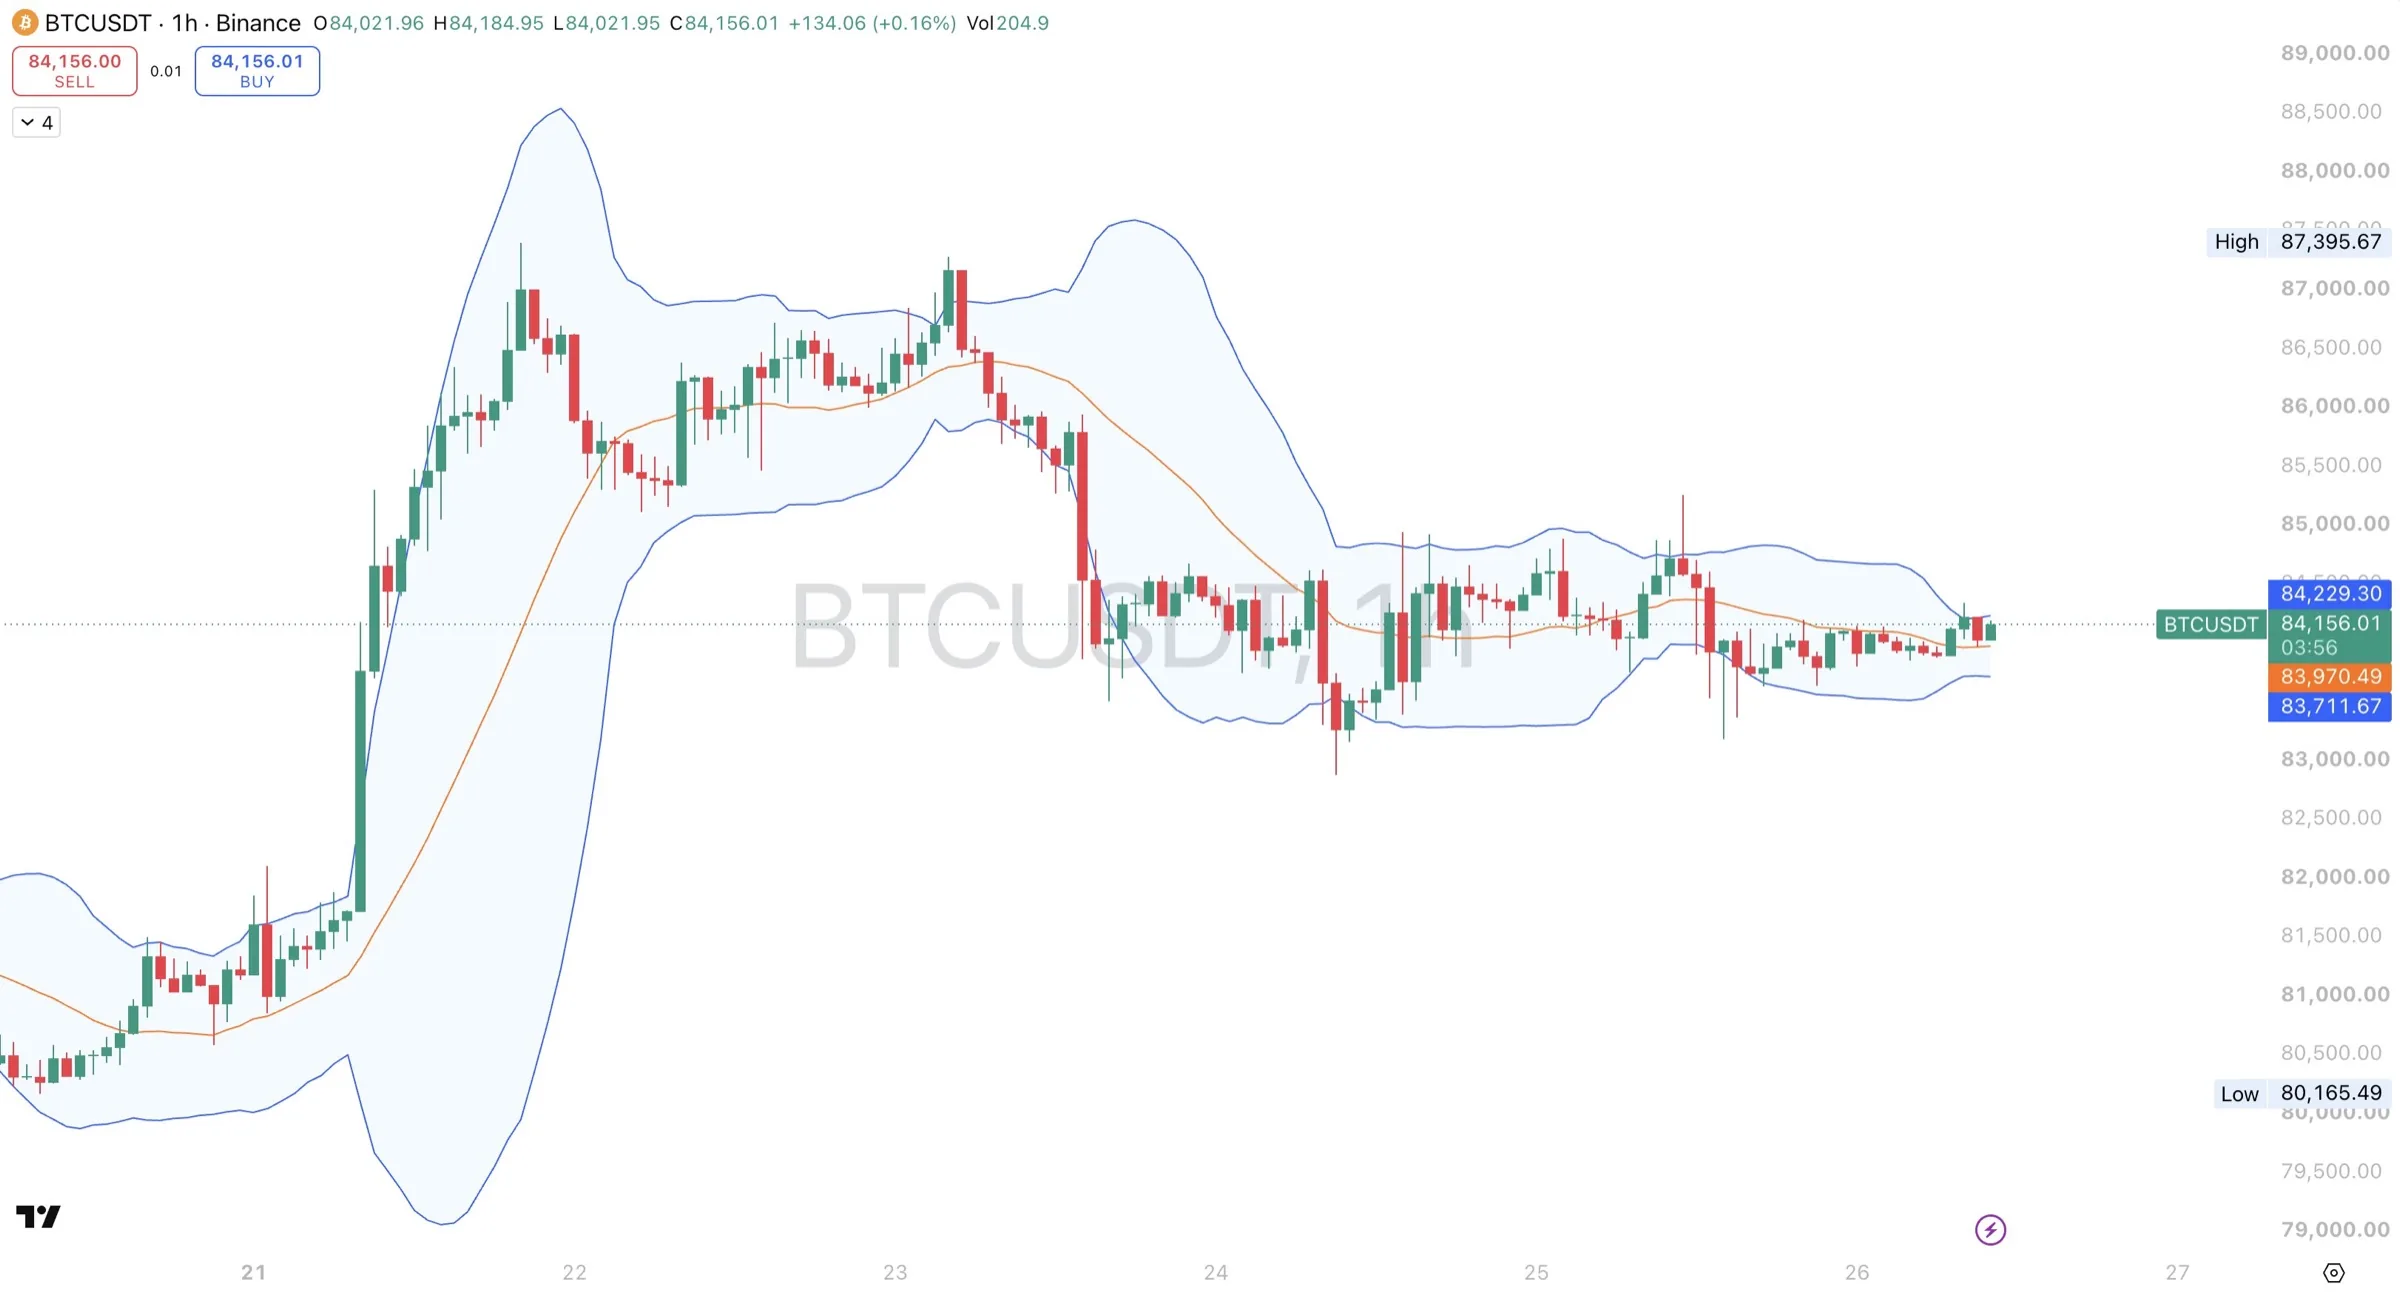
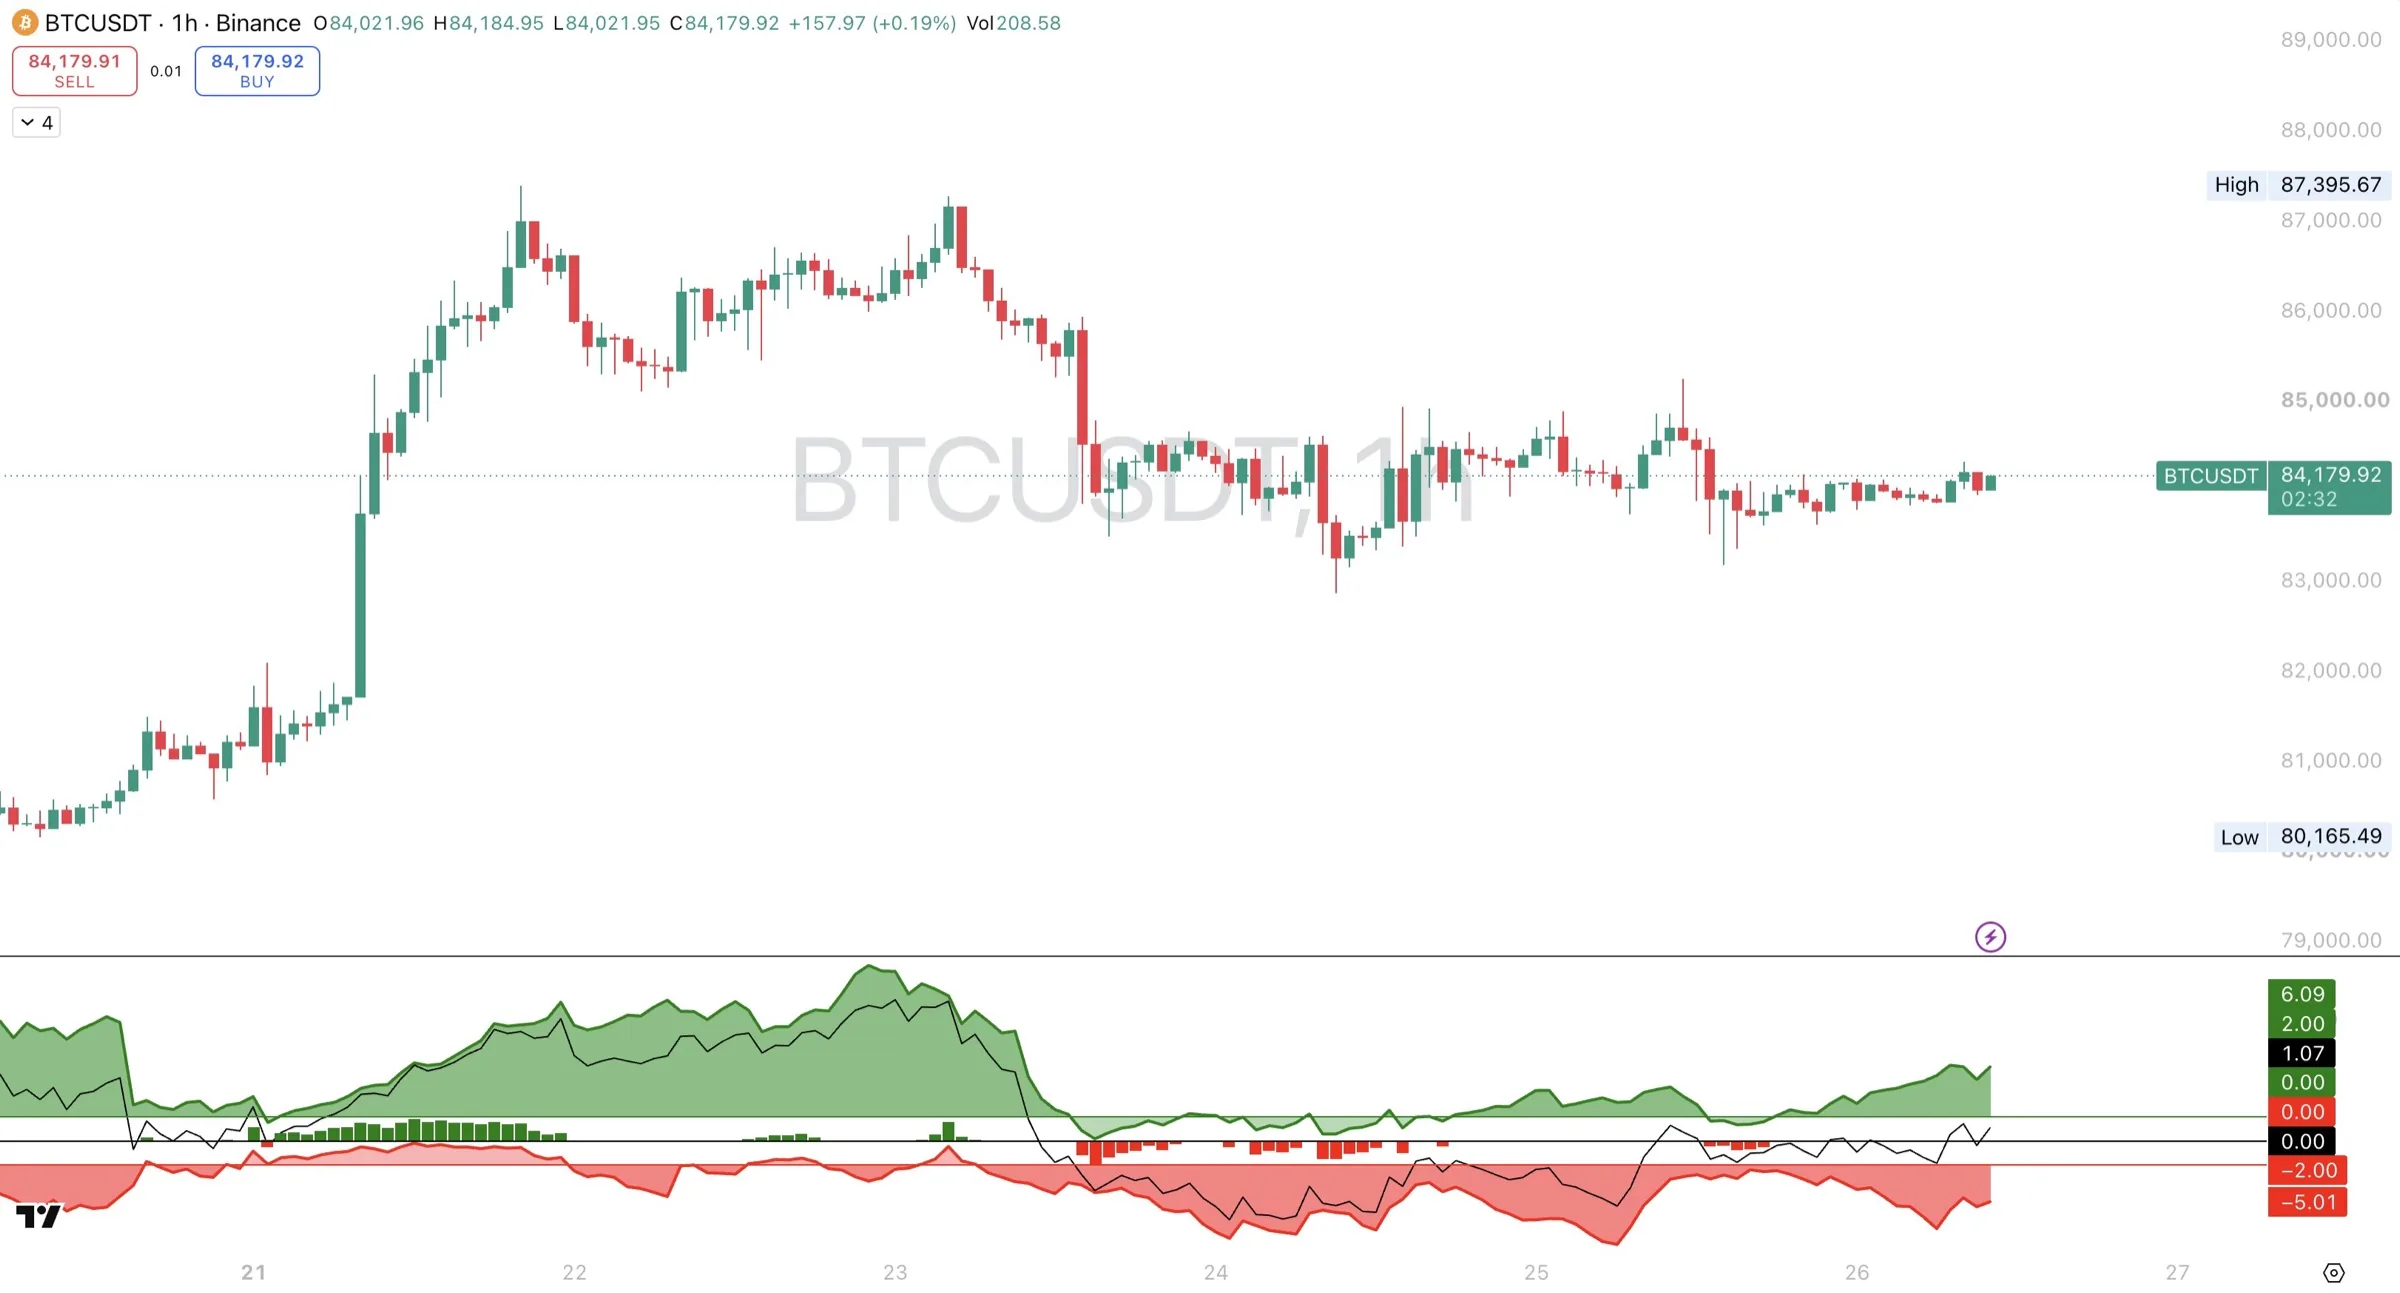
The walkthrough below uses an earlier BTCUSDT 1-hour chart (columns in the old green and red), covering about six days: a quiet start near 81,000, a rally to the 87,395 high, a drop to near 82,900, and a sideways range near 84,000. Here is what Trend Core showed at each stage, reading left to right:
| When | What Trend Core showed | What it meant |
|---|---|---|
| 20th | Trend line hovering near 0, almost no columns | Balanced and quiet. No side in control. |
| 21st | Trend line jumped above +2 with a long run of green columns | Buyers took control as price broke out and rallied. |
| 22nd | Trend line around +10 | Saturated. The rally was stretched. Price paused and pulled back. |
| 23rd | Trend line about +13 at the second peak, then turned down as the green columns stopped | Deep saturation followed by the first sign of a turn. This was the warning before the drop. |
| 23rd to 24th | Trend line fell through 0 to around -6, with red columns | Sellers took control. Price dropped to near 82,900. |
| 25th | Red columns faded and the Trend line climbed back toward 0 | Selling pressure exhausted. The drop stopped. |
| 25th to 26th | Trend line between about 0 and +1 | Balanced again. The latest reading is +1.1, so neither side is in control and the next move is still undecided. |
What to take from it:
- Green columns and a rising line confirmed the rally. Trend Core showed real strength behind the breakout on the 21st.
- Saturation warned before the top. Readings of +10 and above on the 22nd and 23rd said the rally was stretched well before price turned.
- The turn showed up in the columns first. The green columns stopped and the line rolled over before the big red candles.
- A reading near 0 means wait. On the 25th to 26th, Trend Core says the market has not picked a direction yet.
Using it with Whip Trend Confirmation
The two are built as a pair. Trend Confirmation shows you the trend and when it flips. Trend Core shows you the strength behind it. Read the signal on the price chart, check the value in the Trend Core panel, then decide.
| Trend Confirmation shows | Trend Core shows | What it usually means |
|---|---|---|
| CONFIRM BUY | Trend line rising through 0 or above +2, green columns | Strong setup. Signal and pressure agree. |
| CONFIRM BUY | Trend line saturated, above +8 | Late. The move is already stretched. Size down or wait for a pullback. |
| BUY | Trend line easing back from below -8, selling columns shrinking | Sellers backing off. Early reversal attempt. Higher risk, better price. |
| BUY | Trend line still falling below -2, red columns growing | Sellers still in control. Likely a bounce only. Be cautious. |
| CONFIRM SELL | Trend line falling through 0 or below -2, red columns | Strong setup. Signal and pressure agree. |
| CONFIRM SELL | Trend line saturated, below -8 | Late. The move is already stretched. Size down or wait for a bounce. |
| SELL | Trend line easing back from above +8, buying columns shrinking | Buyers backing off. Early reversal attempt. Higher risk, better price. |
| SELL | Trend line still rising above +2, green columns growing | Buyers still in control. Likely a pullback only. Be cautious. |
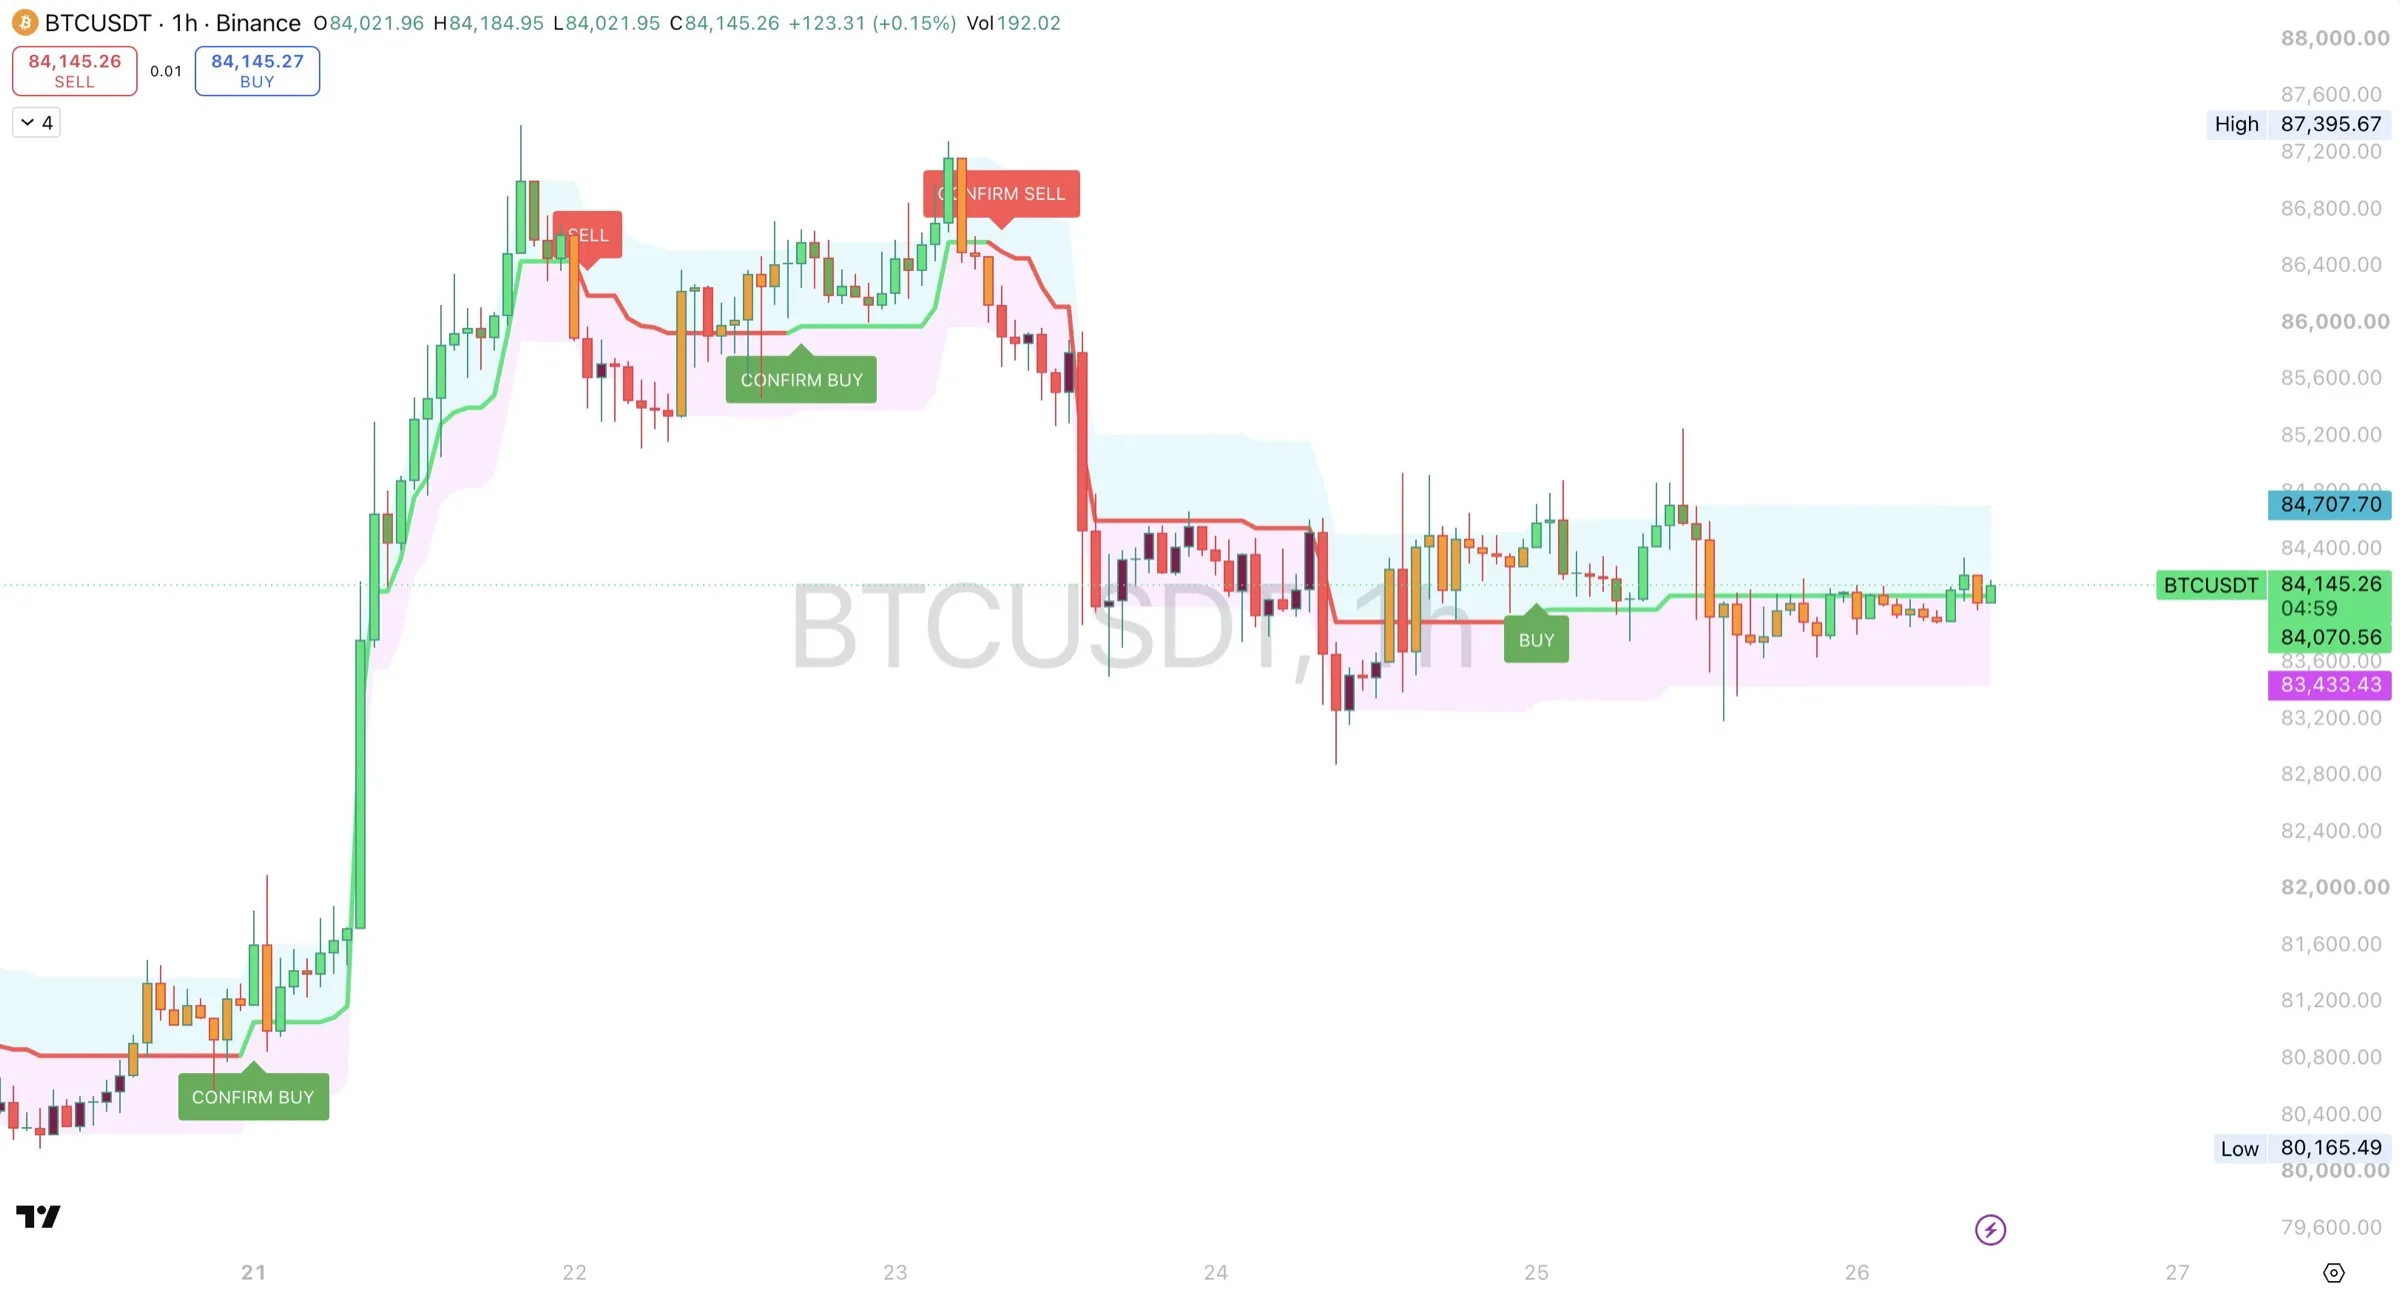
The screenshot shows how this looks in practice. On the 20th, the Trend line hovered near 0: a balanced market. When price broke out on the 21st, Trend Confirmation printed a CONFIRM BUY while Trend Core climbed fast with a run of green columns, so signal and strength agreed. By the 22nd and 23rd the Trend line had reached around +10 to +13, a saturated reading, and Trend Confirmation printed a CONFIRM SELL at the second peak on the 23rd. Trend Core then fell through 0 with red columns as price dropped to near 82,900.
A simple routine:
- Check Trend Core first. Note whether the Trend line is above or below 0, which way it is heading, and whether it is saturated. Glance at the table for the other timeframes.
- Wait for a signal on Trend Confirmation.
- Take signals that agree with Trend Core. Treat signals that disagree with extra caution.
- When Trend Core reaches a saturated reading in your trade's favor, tighten your stop or take partial profit, and watch for the opposite signal.
Across timeframes. The same 1H / 4H approach from the Trend Confirmation guide applies. Use 30m or 1H for early signals and 4H for confirmed ones, and check Trend Core on the timeframe you are trading. A saturated reading on 4H carries more weight than one on 1H.
Spotting a trend flip with both indicators
This is the most useful way to combine the two. When a trend has run hard in one direction, Trend Core tells you it is saturated, and Trend Confirmation tells you when it actually flips.
The setup. Trend Confirmation has printed a SELL or CONFIRM SELL and price has dropped a lot. On Trend Core, the Trend line has fallen below -8 and the saturation band is showing. Selling pressure is at an extreme and the down trend is stretched. When the band ends and a triangle prints, sellers have started to ease off, and a flip to BUY or CONFIRM BUY becomes possible.
The same works in reverse. After a BUY or CONFIRM BUY and a big rally, a Trend line above +8 means buying pressure is saturated, and a triangle near the top means buyers have started to ease off.
Check it on 1H and 4H. Look at both indicators on both timeframes. The table shows the 4H reading without switching charts. The picture is strongest when they agree.
| What to check | 1H | 4H |
|---|---|---|
| Trend Confirmation | Last label is SELL / CONFIRM SELL. Watch for the first BUY. | Last label is SELL / CONFIRM SELL. Watch for CONFIRM BUY. |
| Trend Core reading | Saturated, below -8 | Saturated, or heading there |
| Signs of exhaustion | Saturation band ends, triangle prints, selling columns shrinking | Selling columns shrinking, Trend line flattening or turning up |
| The flip | BUY or CONFIRM BUY prints. This is the early entry. | CONFIRM BUY prints. This is the confirmed entry. |
How to read the combinations:
| 1H | 4H | What it usually means |
|---|---|---|
| Saturated, BUY prints | Still falling, not saturated | A short-term bounce inside a bigger down trend. Trade small or wait. |
| Saturated, BUY prints | Saturated, turning up | Both timeframes exhausted at the same time. A stronger case for a real reversal. |
| BUY or CONFIRM BUY, Trend line back toward 0 | CONFIRM BUY | Highest-quality setup. The flip is confirmed on both timeframes. |
| Saturated, no label yet | Saturated | The flip may be close, but it has not happened. Wait for the label. |
Step by step:
- After a big move, check Trend Core on 1H and 4H. Note whether either reading is saturated.
- If it is, stop adding to the trend and protect profits on open positions in that direction.
- Watch the 1H for the first opposite label (BUY after a sell-off, SELL after a rally). That is your early signal.
- Watch the 4H for the CONFIRM label in the same direction. That is your confirmed signal.
- Enter early on the 1H with a smaller position, or wait for the 4H confirmation and accept a slightly worse price. Set your stop before you enter either way.
Saturation does not time the flip. A saturated reading says the move is stretched, not that it ends on this candle. In our testing, stretched moves in trending markets such as Bitcoin often kept going. Never trade against the trend on Trend Core alone. Wait for the label on Trend Confirmation.
Example from the screenshot. After the rally on the 21st, the Trend line stayed high and reached around +10 on the 22nd and about +13 at the second peak on the 23rd. That is a saturated reading: buyers had pushed as far as they could. The green columns stopped, the Trend line turned down, and Trend Confirmation printed a CONFIRM SELL. Price then dropped from near 87,200 to near 82,900, and the Trend line fell to around -6 on the 24th. When the red columns faded and the line climbed back toward 0 on the 25th, Trend Confirmation printed a BUY, and the market moved sideways in the balanced zone.
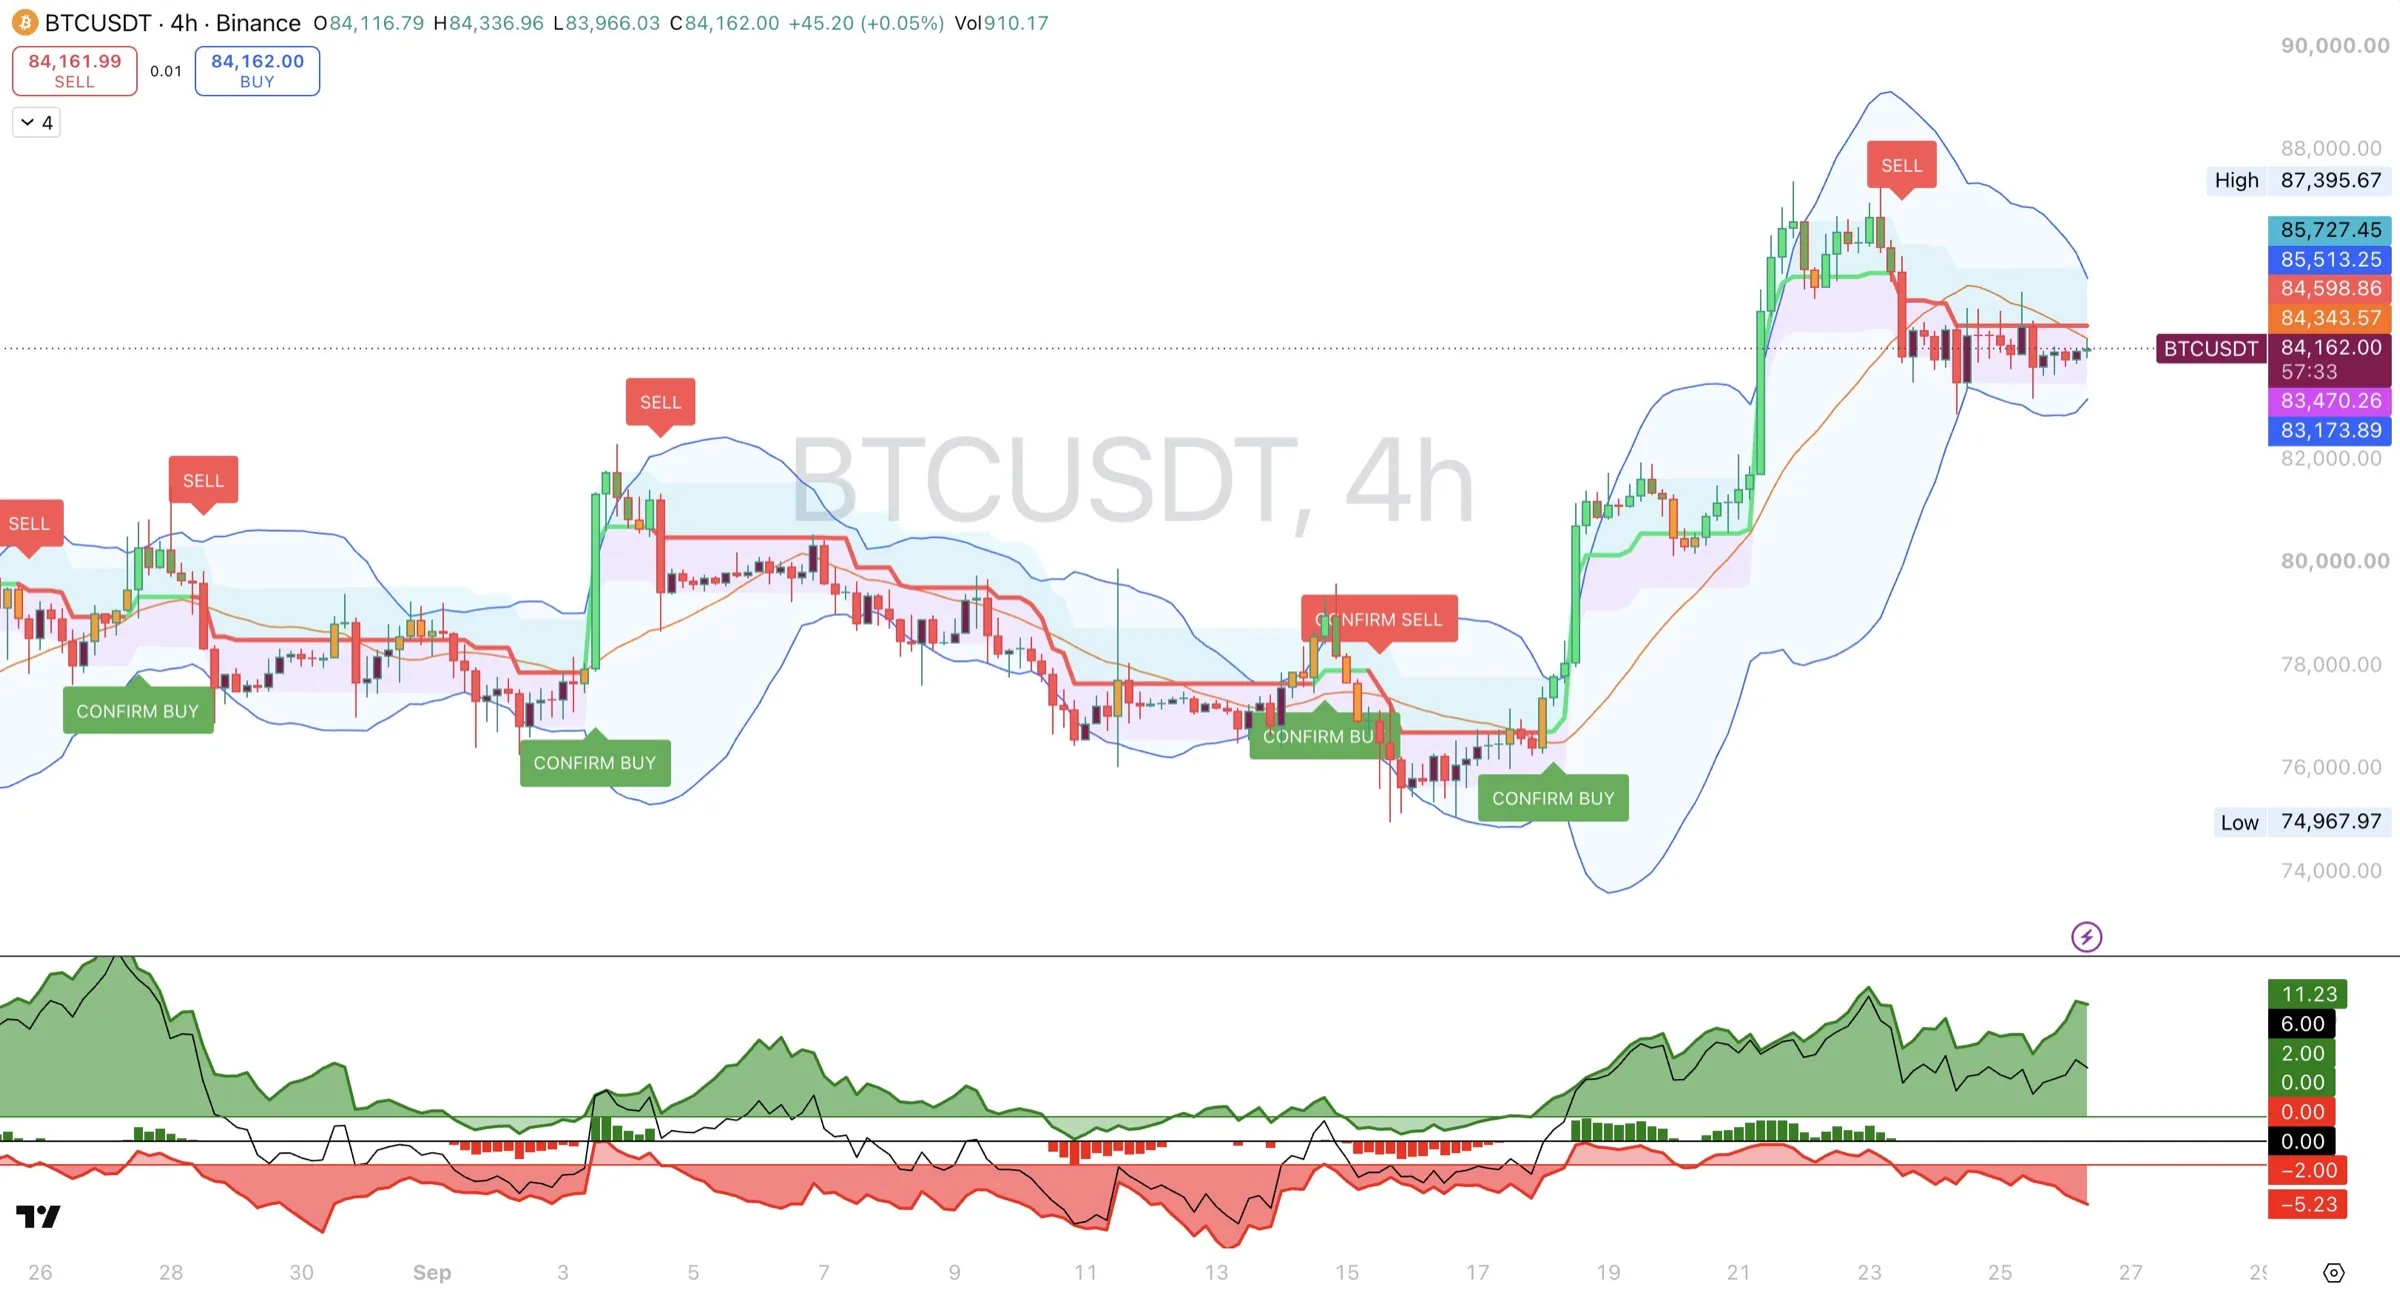
The same market on 4H. Here is the 4-hour chart of the market in the screenshot above. Trend Core is in the lower panel.
| When | 4H Trend Core | What happened |
|---|---|---|
| Late Aug | Peaked around +15, then turned down | Trend Confirmation printed a SELL and price drifted lower. Saturation before a turn. |
| 11th to 13th Sep | Fell to around -7 to -8, with red columns | Selling was stretched. The bottom took a few days to form, with one failed CONFIRM BUY on the 14th. |
| 18th | Red columns faded and the line climbed through 0 | Trend Confirmation printed a CONFIRM BUY near 76,500 and the rally began. |
| 22nd | Around +12, with green columns | Saturated at the top of the rally. |
| 23rd to 26th | Eased back to about +6, still above 0 | Trend Confirmation printed a plain SELL, but buyers still control the 4H picture. |
Compare this with 1H. During the drop on the 23rd to 24th, 1H Trend Core fell to around -6 while 4H Trend Core stayed at about +6. Sellers won on the short timeframe, but the bigger uptrend held. When the two timeframes disagree like this, treat the 1H move as a pullback until the 4H reading falls toward 0 as well.
The 4H chart also shows that saturation does not time the flip exactly. After the -7 to -8 readings in mid-September, the first CONFIRM BUY on the 14th failed within a day. The move that lasted started on the 18th, once the red columns had faded and the line had climbed back through 0. That is why the guide says to wait for the label and the turn, not just the extreme reading.
And on 30m. Here is the same market on the 30-minute chart, covering the 22nd to the 26th. Trend Core is in the lower panel.
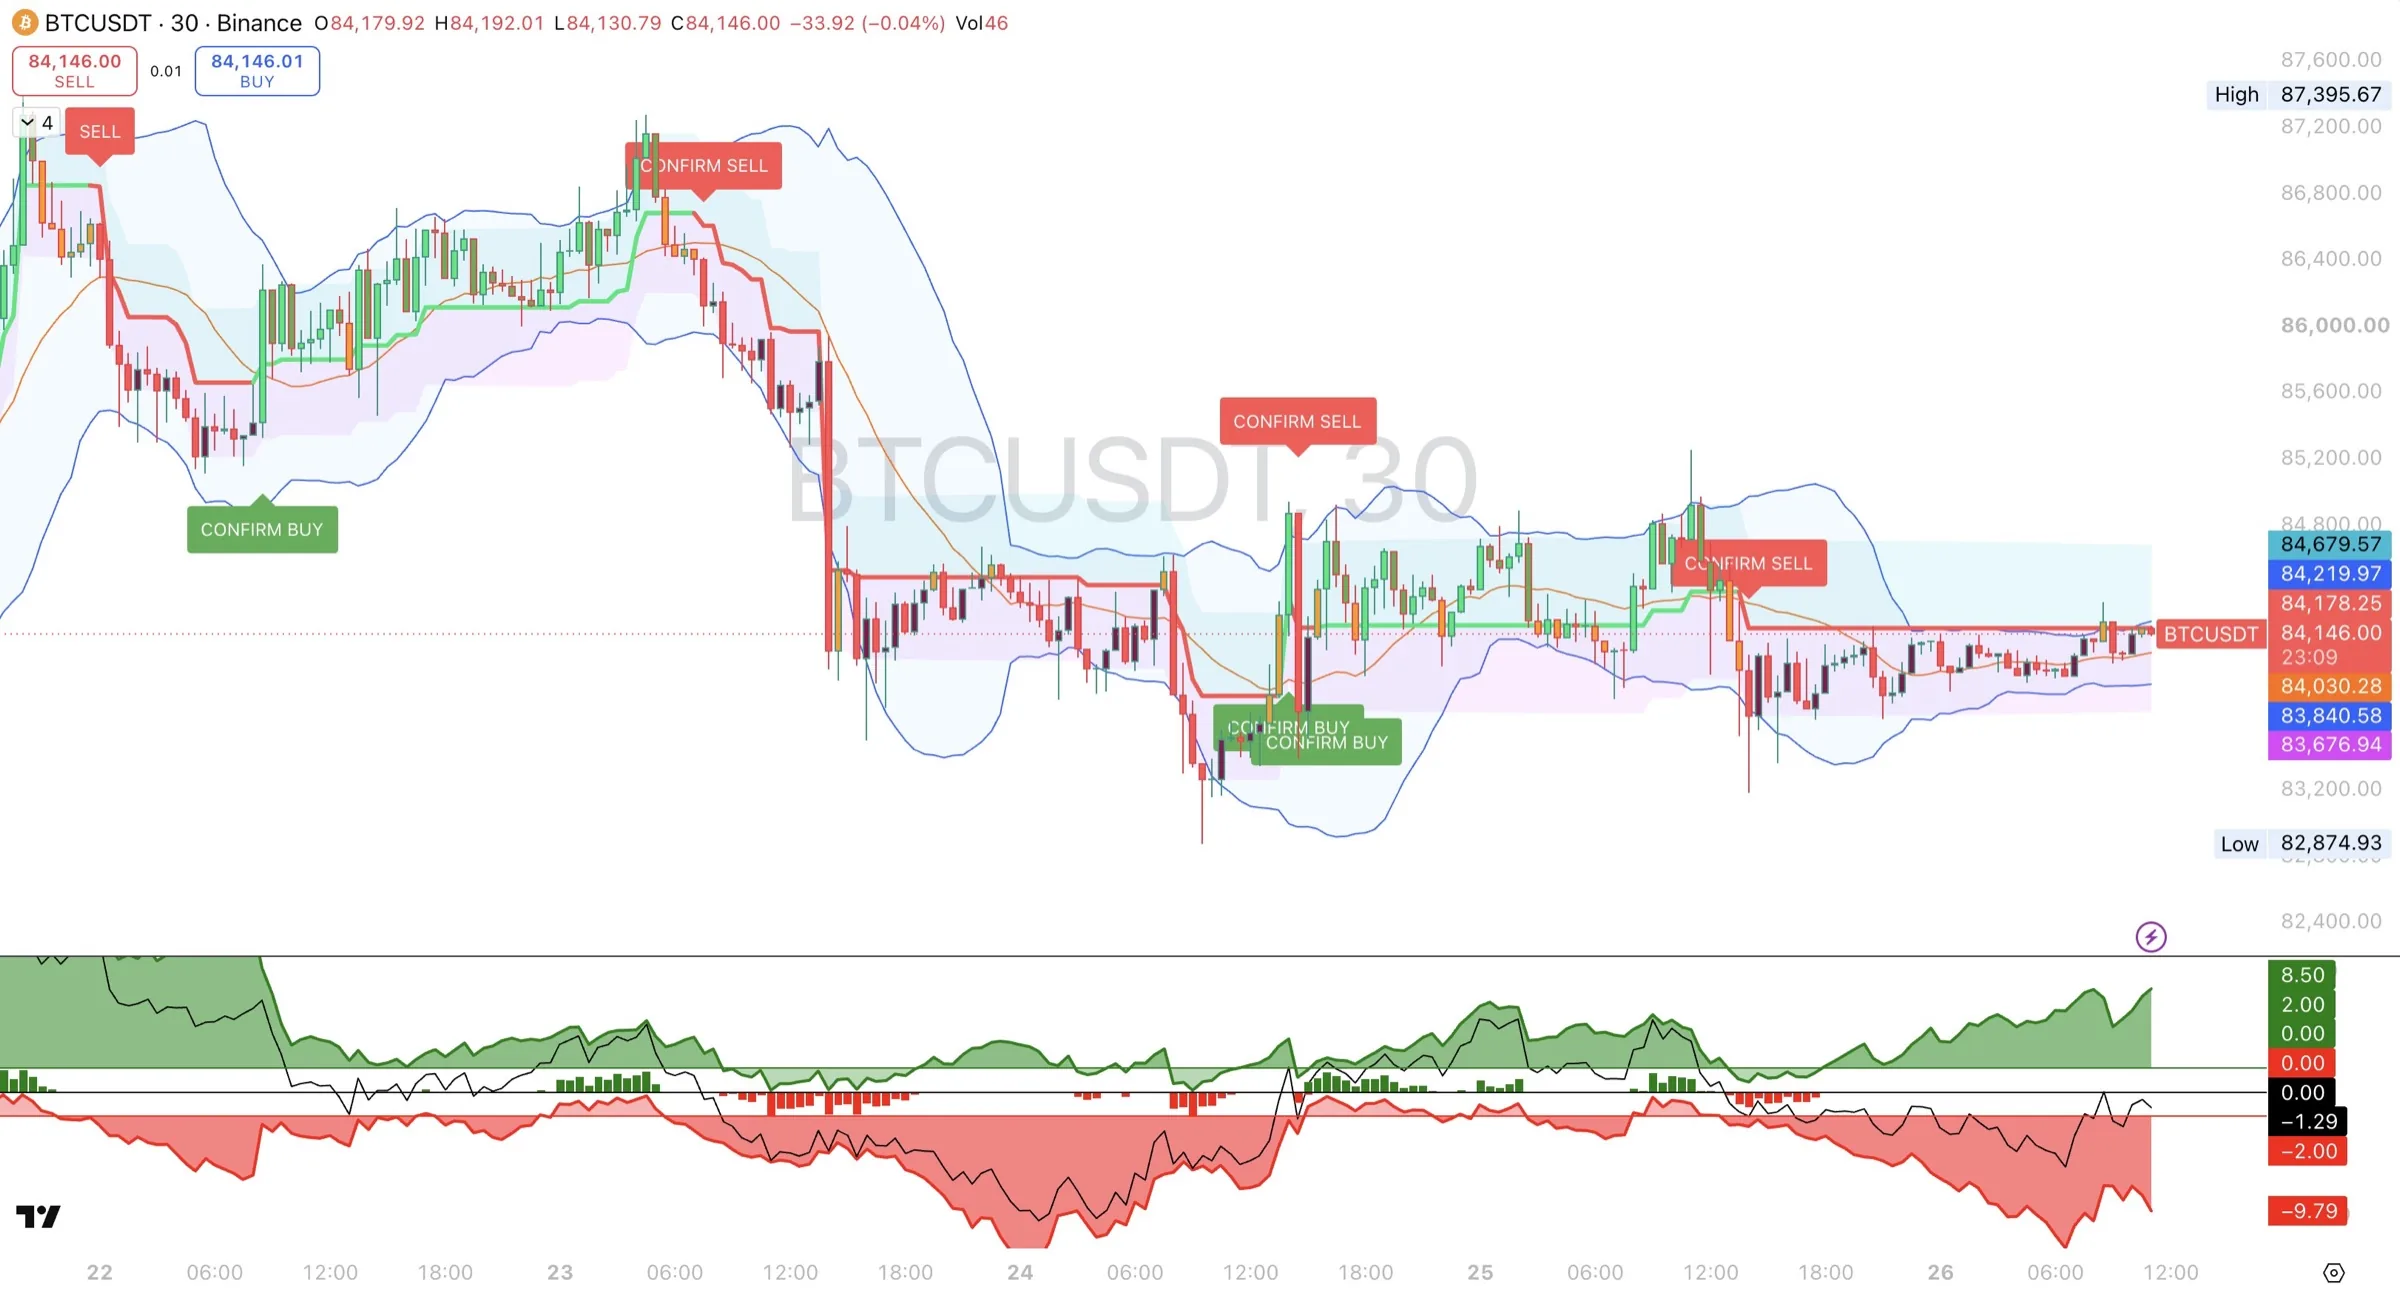
The 30m chart shows the saturation pattern from this section clearly. After the CONFIRM SELL on the morning of the 23rd, the Trend line fell to around -10 early on the 24th as price dropped to the 82,875 low. The red columns then faded, the line turned up, and Trend Confirmation printed a CONFIRM BUY that afternoon, almost a day before the 1H BUY.
The same drop looked very different on each timeframe:
| Timeframe | Lowest Trend Core reading in the drop | What it said |
|---|---|---|
| 30m | Around -10 | Saturated. A bounce was close. |
| 1H | Around -6 | Sellers in control, but not yet extreme. |
| 4H | Stayed around +6, never below 0 | Only a pullback in a bigger uptrend. |
Faster timeframes reach extreme readings more easily. A 30m reading of -10 is an early warning, not proof on its own. It carries the most weight when 1H is also turning and 4H is not pointing strongly the other way.
How Trend Core fits the Whip system
Each Whip module answers a different question. Read together, they give you a complete picture before you take a trade.
| Module | Question it answers | What you look at |
|---|---|---|
| Whip Trend Core | How strong is the trend, and is it saturated? | The Trend line value, its direction, and the columns |
| Whip Trend Confirmation | Has the trend flipped, and is the flip confirmed? | BUY / SELL and CONFIRM BUY / CONFIRM SELL labels |
| Whip Channel Pro + S/R | Where is price, where are the key levels, and is volatility expanding or contracting? | The channel boundaries and the support and resistance levels |
A simple order to read them in:
- Trend Core: strength. Who is in control, and is the move normal, strong or saturated?
- Trend Confirmation: timing. Has a BUY, SELL or CONFIRM label printed?
- Channel Pro: location. Is price in a sensible place to enter, or already stretched to a boundary?
The more the three agree, the stronger the setup. When they disagree, wait, trade smaller, or skip it. Do this on both 1H and 4H.
Examples of agreement:
- Trend Confirmation prints CONFIRM BUY, Trend Core is rising back through 0 after a saturated low, and price is not pressed against an upper boundary on Channel Pro. All three point the same way.
- Trend Core is saturated above +8, price is stretched to a boundary on Channel Pro, and Trend Confirmation prints a SELL on 1H. Three separate signs that the rally is running out of steam.
Examples of disagreement:
- A CONFIRM BUY prints, but Trend Core is already saturated. The signal is late.
- Trend Core says buyers are in control, but Trend Confirmation has just printed a SELL. Likely a pullback, not a new trend.
For the full workflow using all three modules together, see the Whip System Complete Guide.
Settings
Trend Core
| Setting | Default | What it changes |
|---|---|---|
| Smooth Trend line | Off | Replaces the Trend line with a smoother version that shows the underlying slope. Markers, bands, alerts and the table always use the normal reading. |
| Smoothing length | 8 | How much smoothing the smoothed line uses. Higher is smoother and slower. |
| Show unsmoothed line when smoothing | Off | Also draws the normal reading as a faint line, so you can see exactly what triggers the markers and alerts. |
Saturation
| Setting | Default | What it changes |
|---|---|---|
| Saturation level mode | Fixed level | Fixed level, Auto, or a preset for crypto, gold and metals, forex or indices. See Choosing the saturation level. |
| Fixed saturation level | 8 | Where saturation starts when the mode is Fixed level. |
| Saturation reset buffer | 1 | How far back inside the level a reading must move before it counts as leaving saturation. |
| Highlight saturated readings | On | Shades the panel background while the reading is saturated. |
Markers
| Setting | Default | What it changes |
|---|---|---|
| Mark when a saturated move starts to ease | On | Prints the triangle markers. |
| Mark zero-line crosses | Off | Prints a dot where the Trend line crosses 0. |
Multi-timeframe readout
| Setting | Default | What it changes |
|---|---|---|
| Show readout table | On | Shows or hides the table. |
| Show bull and bear pressure | On | Adds the Bull and Bear columns. |
| Use closed candles only | On | Shows each timeframe's last closed candle, so the table does not change mid-candle. Turn off for live values. |
| Hide timeframes below the chart | On | Hides rows for timeframes shorter than your chart. |
| Timeframes 1 to 4 | 30m, 1H, 4H, 1D | The timeframes in the table. Timeframe 4 can be switched off. |
| Table position and text size | Top right, Small | Where the table sits and how big its text is. |
The Colors group sets the buyers, sellers, Trend line and balanced-zone colors. The defaults work on every market and timeframe; most traders only ever change the saturation mode.
Alerts
Trend Core has six preset alerts. Each one uses the normal (unsmoothed) reading and fires once per change, with the reset buffer stopping repeat alerts when the line hovers around a level.
| Alert | When it fires | Why it matters |
|---|---|---|
| Trend crossed above 0 | Buyers took control | Early sign of a bullish trend change. |
| Trend crossed below 0 | Sellers took control | Early sign of a bearish trend change. |
| Bullish saturation | The reading enters bullish saturation | The up move is stretched. Stop chasing and protect profits. |
| Bearish saturation | The reading enters bearish saturation | The down move is stretched. Stop chasing and protect profits. |
| Leaving bullish saturation | The reading eases back from bullish saturation | Buyers are easing off. Watch Trend Confirmation for a SELL. |
| Leaving bearish saturation | The reading eases back from bearish saturation | Sellers are easing off. Watch Trend Confirmation for a BUY. |
To set one up:
- Open the Alerts panel and click Create alert (or press Alt+A).
- Under Condition, choose Whip Trend Core, then pick the alert by name.
- Set the trigger to Once per bar close.
- Choose how you want to be notified and save.
The saturation alerts follow your saturation mode, so they use the preset or Auto level if you picked one. You can still alert on the Trend line crossing any level you like by choosing Trend instead of a preset alert.
Limitations
- It measures, it does not signal. Trend Core has no buy or sell labels; its triangles mark saturation easing, not entries. It tells you the strength and state of the trend. Pair it with Trend Confirmation for entries.
- Saturated can stay saturated. In a powerful trend, readings can stay beyond the saturation level for many candles. A saturated reading is a reason to stop chasing, not a reason to trade against the trend on its own.
- The live candle moves. Values on the candle that is still forming update with price. Judge readings on closed candles.
- Sudden spikes distort it briefly. A news candle can push readings to an extreme for a bar or two. Give it a few candles before reading too much into one spike.
- Needs history. On a newly listed symbol, or at the very start of the chart data, early readings are unreliable.
- Past readings do not predict future ones. Use it as one input in your analysis, with proper risk management.
FAQ
Getting started
What does Trend Core tell me?
Who is in control (buyers or sellers), how strong that control is, and whether a move has gone so far that it is saturated and likely to turn.
Which line should I watch first?
The thin Trend line. It is the net reading of buyers versus sellers. The columns give you a quick read of who is pushing right now, and the table shows the same reading on your other timeframes.
What is the fastest way to learn to read it?
Go through the example charts in this guide: the 1H walkthrough in Reading the example chart, then the 4H and 30m examples in the flip section. Then scroll back through your own market and read each stretch the same way: where the Trend line was, which way it was heading, and what the columns were doing.
Why are there no buy and sell labels?
Trend Core is the strength gauge of the Whip system. The labels come from Whip Trend Confirmation. Using both gives you the signal and the strength behind it.
Do I need to change any settings?
No. The defaults work on every market and timeframe. If saturation shows up too often or too rarely on your market, try its preset or Auto. See Choosing the saturation level.
What changed in the update?
A multi-timeframe table, a default saturation level of 8 with presets and an Auto mode, saturation bands, triangle markers, six preset alerts, and new purple and black colors. The readings themselves work the same way.
Reading the values
What is a normal reading?
Most of the time the Trend line moves between -2 and +2. Beyond +2 or -2, one side is clearly in control. Beyond ±8 (the default saturation level), the move is saturated.
Can the reading go past +10 or -10?
Yes. On the examples, 1H reached about +13 at the top on the 23rd and 4H reached about +15 in late August. The further past the saturation level, the more stretched the move.
What is the default saturation level, and should I change it?
8. Crypto and metals often run further before they are truly stretched, so their presets use 10, forex uses 9 and indices 12. Auto sets the level from your own chart's history.
What does saturated mean?
The trend has been pushed so far in one direction that the side driving it is running out of fuel. A pause or a flip becomes more likely.
The reading is at -10. Is the trend going to flip?
Not necessarily. Saturation means the move is stretched, not that it will turn. In our testing, stretched moves in trending markets such as Bitcoin and gold often kept going, while range-bound markets such as EUR/USD pulled back more often. On the 4H example, the first CONFIRM BUY after the mid-September lows failed within a day, and the lasting move started on the 18th. Wait for BUY or CONFIRM BUY on Trend Confirmation before trading the turn.
What do the grey bands and triangles mean?
A grey band means the reading is saturated. When the reading eases back inside the level, the band ends and a triangle prints: buyers easing off near the top, sellers easing off near the bottom. On the updated screenshot, two bands on October 3 and 4 marked stretched selling after the drop from 87,220, each ending with a triangle.
Why does the Trend line hover around 0 for a long time?
The market is balanced and moving sideways. Signals are less reliable in these stretches. Wait for a clear break above +2 or below -2.
What do the purple and black columns mean?
Purple columns mean buyers are pushing hard. Black columns mean sellers are pushing hard. When the columns shrink and stop, that push is fading. On the older 1H example (green and red columns), the buying columns stopping on the 23rd came before the big red candles.
What is divergence?
Price makes a new high or low, but the Trend line does not. It means the push behind the move is weakening and often shows up before a flip.
Using it with Trend Confirmation
How do I use the two together?
Trend Confirmation shows the trend and when it flips. Trend Core shows the strength behind it. Read the label, check the Trend Core value on the same timeframe, then decide.
I have a CONFIRM SELL and Trend Core is at -9. Should I still sell?
The signal is valid, but the move is already stretched. You would be selling late, near a likely exhaustion point. Many traders skip it, size down, or wait for a bounce.
I have a CONFIRM SELL and Trend Core is at -9. What should I watch for?
A flip. Shrinking red columns and a Trend line turning up are the early signs. Then check 1H for the first BUY and 4H for a CONFIRM BUY.
What is the strongest setup?
A CONFIRM label on both 1H and 4H while the Trend line is moving strongly the same way without being saturated. On the 1H example, the CONFIRM BUY on the 21st with the Trend line jumping above +2 and a long run of green columns was that kind of setup.
Timeframes
Which timeframe should I use?
Use more than one. Decide direction on 4H, confirm on 1H, and use 30m only to time the entry. The table shows all of them on one chart.
How do I read the table?
Each row is one timeframe: its Trend reading, bull and bear pressure, and a state in plain English. On the updated screenshot, 1H read -2.3 (sellers in control), 4H 2.0 (balanced) and 1D 10.5 (saturated, buyers): a short-term pullback inside a stretched daily move.
Why does the table differ from the live line?
By default the table uses each timeframe's last closed candle, so it stays put while the current candle forms. Turn off Use closed candles only to see live values.
Why is 30m missing from the table?
Timeframes shorter than your chart are hidden by default. On a 1H chart, 30m is hidden; on a 30m chart, it shows.
Why was 1H Trend Core negative while 4H stayed positive?
They measure different-sized trends. During the drop on the 23rd to 24th, 1H fell to around -6 and 30m to around -10, but 4H stayed around +6. Sellers won the short-term fight, but the bigger uptrend held. Treat a short-timeframe move as a pullback until the 4H reading falls toward 0 as well.
Is a 30m saturation reading as strong as a 4H one?
No. Faster timeframes reach extreme readings more easily. A 30m reading of -10 is an early warning. A saturated 4H reading carries much more weight.
Does it work on other timeframes?
Yes, on any timeframe. The same pairing works with 15m and 1H for day trading, or 4H and Daily for swing trading.
Technical
Does it repaint?
The value on the live candle changes as price moves. Once a candle closes, its reading is final. Always judge readings on closed candles.
Can I get alerts?
Yes. There are six preset alerts: control shifting to buyers or sellers, bullish or bearish saturation, and leaving saturation. See the Alerts section.
Do the markers and alerts use the smoothed line?
No. They always use the normal reading, even when the smoothed Trend line is switched on, so turning smoothing on never delays an alert.
Which markets does it work on?
Crypto, forex, indices, stocks and commodities. The same levels apply on every market, and the presets let you tune saturation for each type.
What is the win rate?
We do not publish one. Results depend on the market, timeframe and how you manage entries, exits and risk. Scroll back through history on your own markets to see how the readings behave before trading them live.
Access
How do I get access?
It is an invite-only script. Buy access at whipalgo.com, or request access at whipalgo.com/contact.
Do I get the other Whip modules too?
See the plans at whipalgo.com, or ask at whipalgo.com/contact. Each module is its own invite-only script.
Disclaimer and access
Disclaimer. This indicator does not predict future price movement and does not guarantee any result. We are not financial advisors. It is provided for educational and technical analysis purposes only. Use it alongside your own analysis and proper risk management, and never risk money you cannot afford to lose.
Access. Whip Trend Core is an invite-only script on TradingView. To buy access, go to whipalgo.com. To request access or ask a question, go to whipalgo.com/contact. Once access is granted, find it under Indicators, then the Invite-only scripts tab, and add it to your chart. It opens in its own panel below the price chart.