Key takeaways
- BUY / SELL is an early flip. CONFIRM BUY / CONFIRM SELL means the flip and the broader trend agree.
- Each trend change is labeled once, and labels are final on candle close.
- Use 30m or 1H for early entries and 4H for confirmed ones.
- A flat line with labels alternating every few candles is a range. Stand aside until it breaks.
Overview
Whip Trend Confirmation tells you when the trend has turned and whether the bigger picture agrees. Instead of guessing from raw candles, you get one clear label per swing, directly on your chart.
It adapts to each market on its own, stays quiet through small, noisy moves, and only reacts when a move is meaningful. Every trend change is then graded, so you can tell an early signal from a confirmed one at a glance.
What you get on the chart:
- BUY / SELL: early trend-change signals. The trend has flipped, but the broader trend has not caught up yet. Earlier entry, more risk.
- CONFIRM BUY / CONFIRM SELL: confirmed trend changes. The short-term flip and the broader trend agree. Later entry, stronger setup.
- An adaptive trend line and volatility clouds that show direction and how much room the market needs.
It works on crypto, forex, indices, stocks and commodities, on any timeframe, and pairs with the other Whip modules for a full read of trend, volatility and timing.
Why traders use it:
- Easy to read. Green line, you are in an uptrend. Red line, a downtrend. A label means the trend just changed. No settings to tune.
- Graded signals. Early and confirmed signals look different, so you always know how much weight a label deserves.
- One label per swing. A clean chart, not an arrow on every candle.
- Built for multiple timeframes. A simple routine: direction on 4H, confirmation on 1H, entry timing on 30m.
- Final on candle close, with alerts. Get notified on your phone instead of watching the chart.
What you see on the chart
| Element | What it shows |
|---|---|
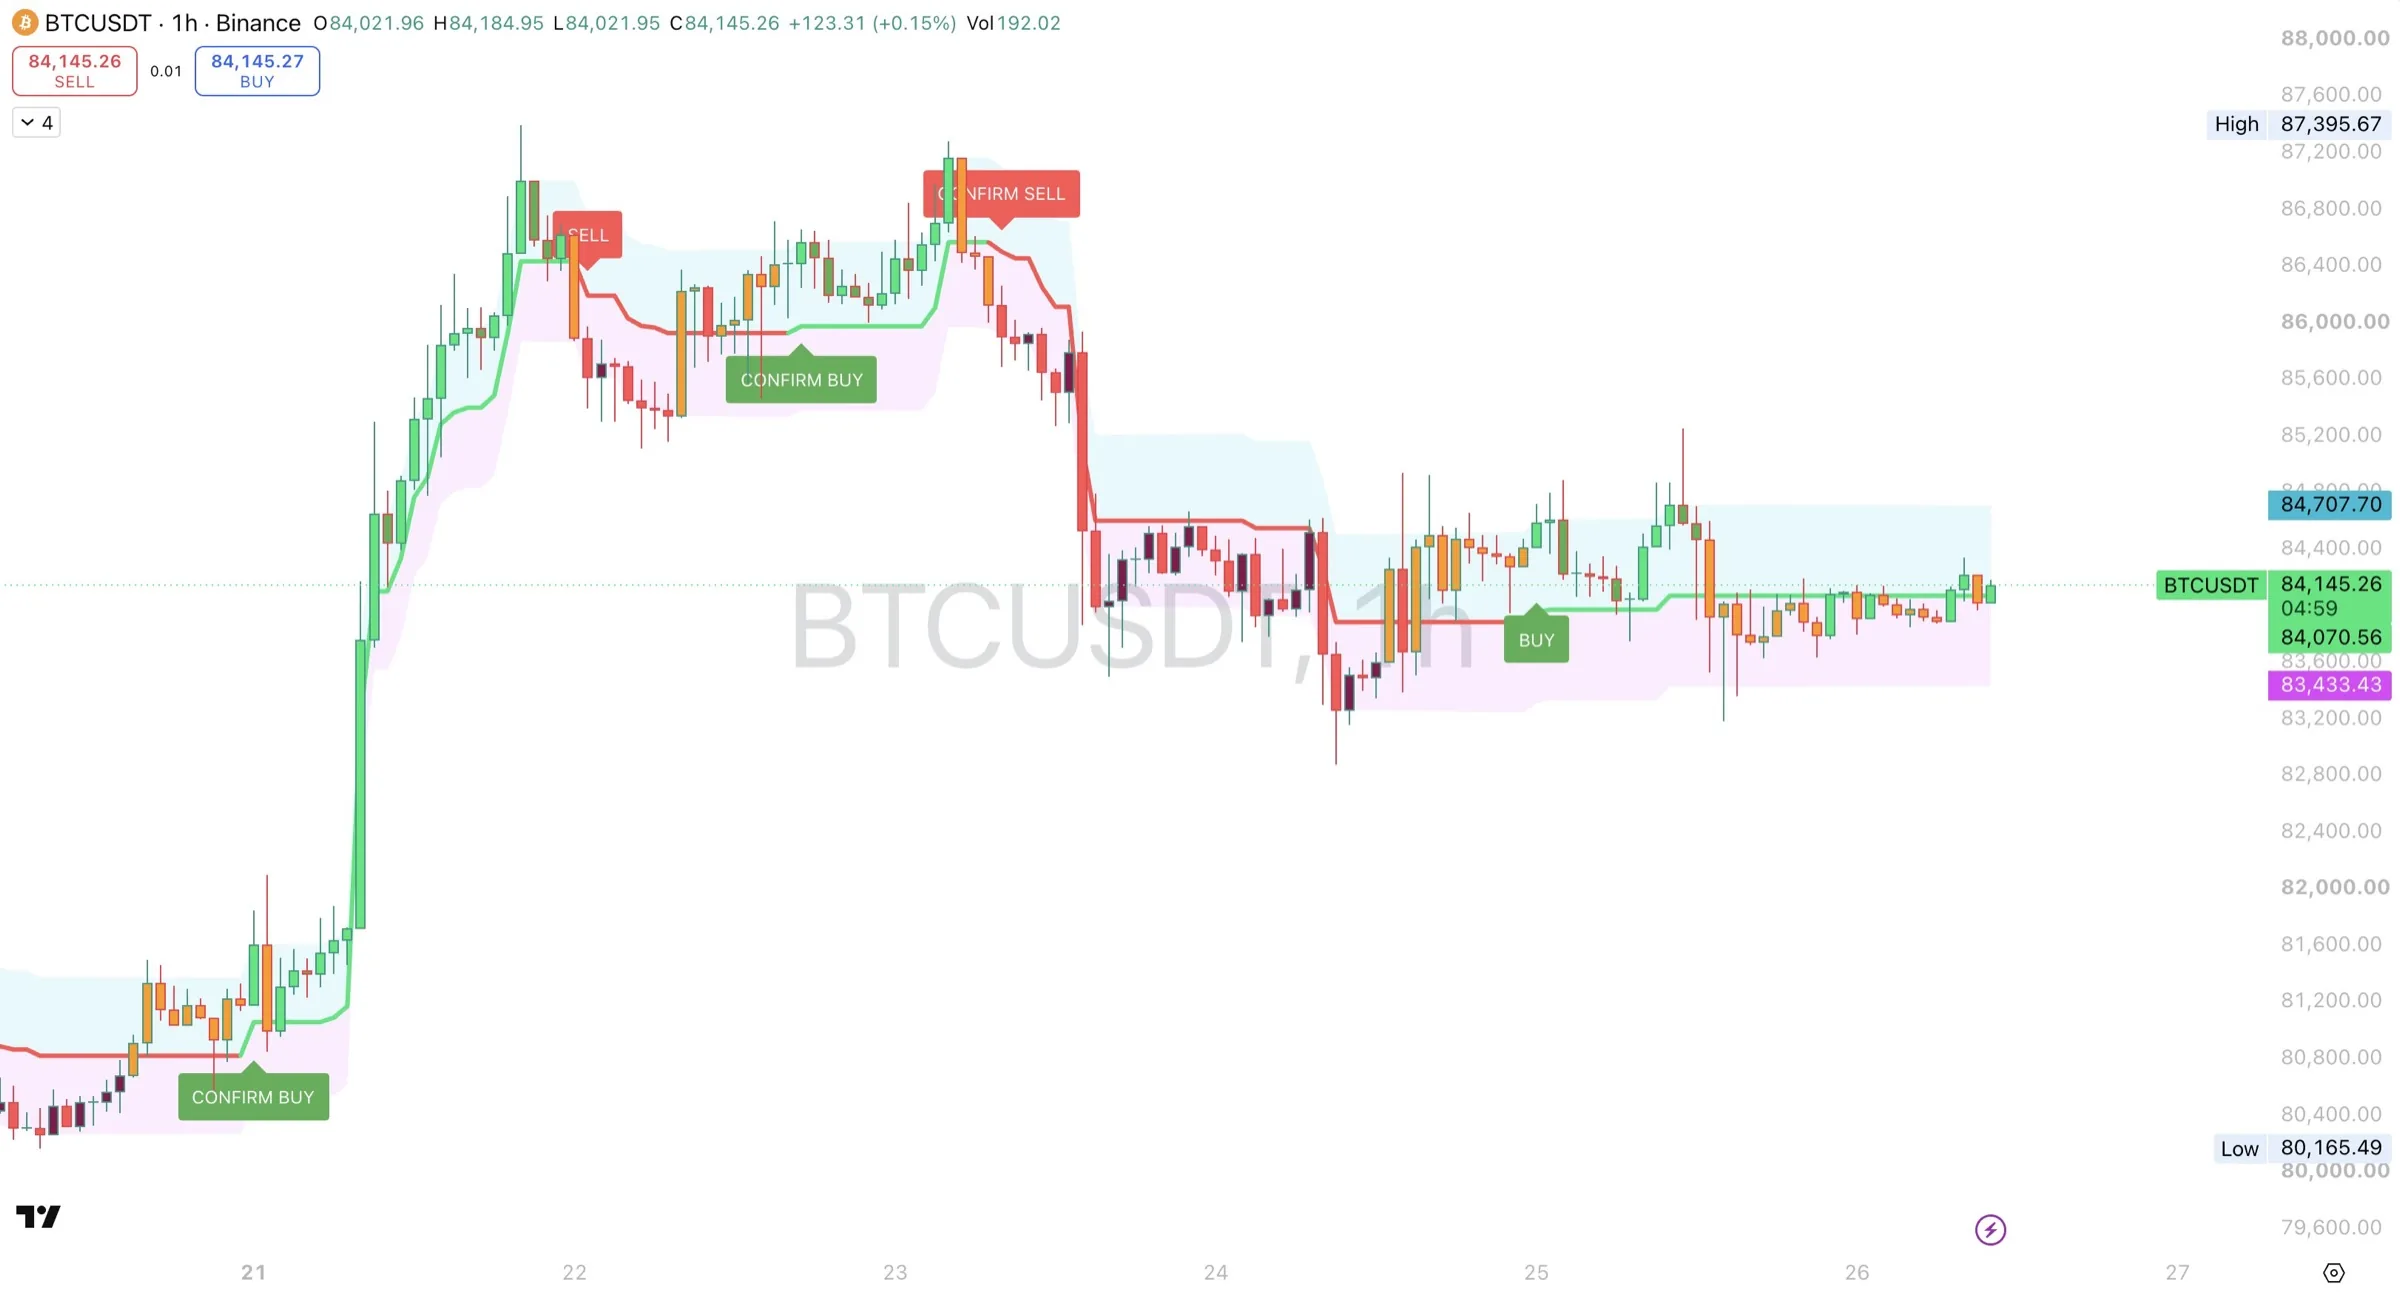
| Trend line (thick line through price) | The current trend level. Green while it is stepping up, red while it is stepping down, orange before any direction is established. |
| Blue cloud (above the line) | The upper volatility band. Its top edge is the High Target. |
| Pink cloud (below the line) | The lower volatility band. Its bottom edge is the Low Target. |
| Candle colors | Green shades in a bullish state, red shades in a bearish state. The shade shows whether the candle closed with or against the trend. Orange means no clear state. |
| BUY / SELL labels | Counter-trend flips. BUY prints below the candle, SELL above it. |
| CONFIRM BUY / CONFIRM SELL labels | Trend flips that agree with the broader trend. Same placement as BUY / SELL. |
The screenshot uses these default colors. You can change any of them in the Style tab.
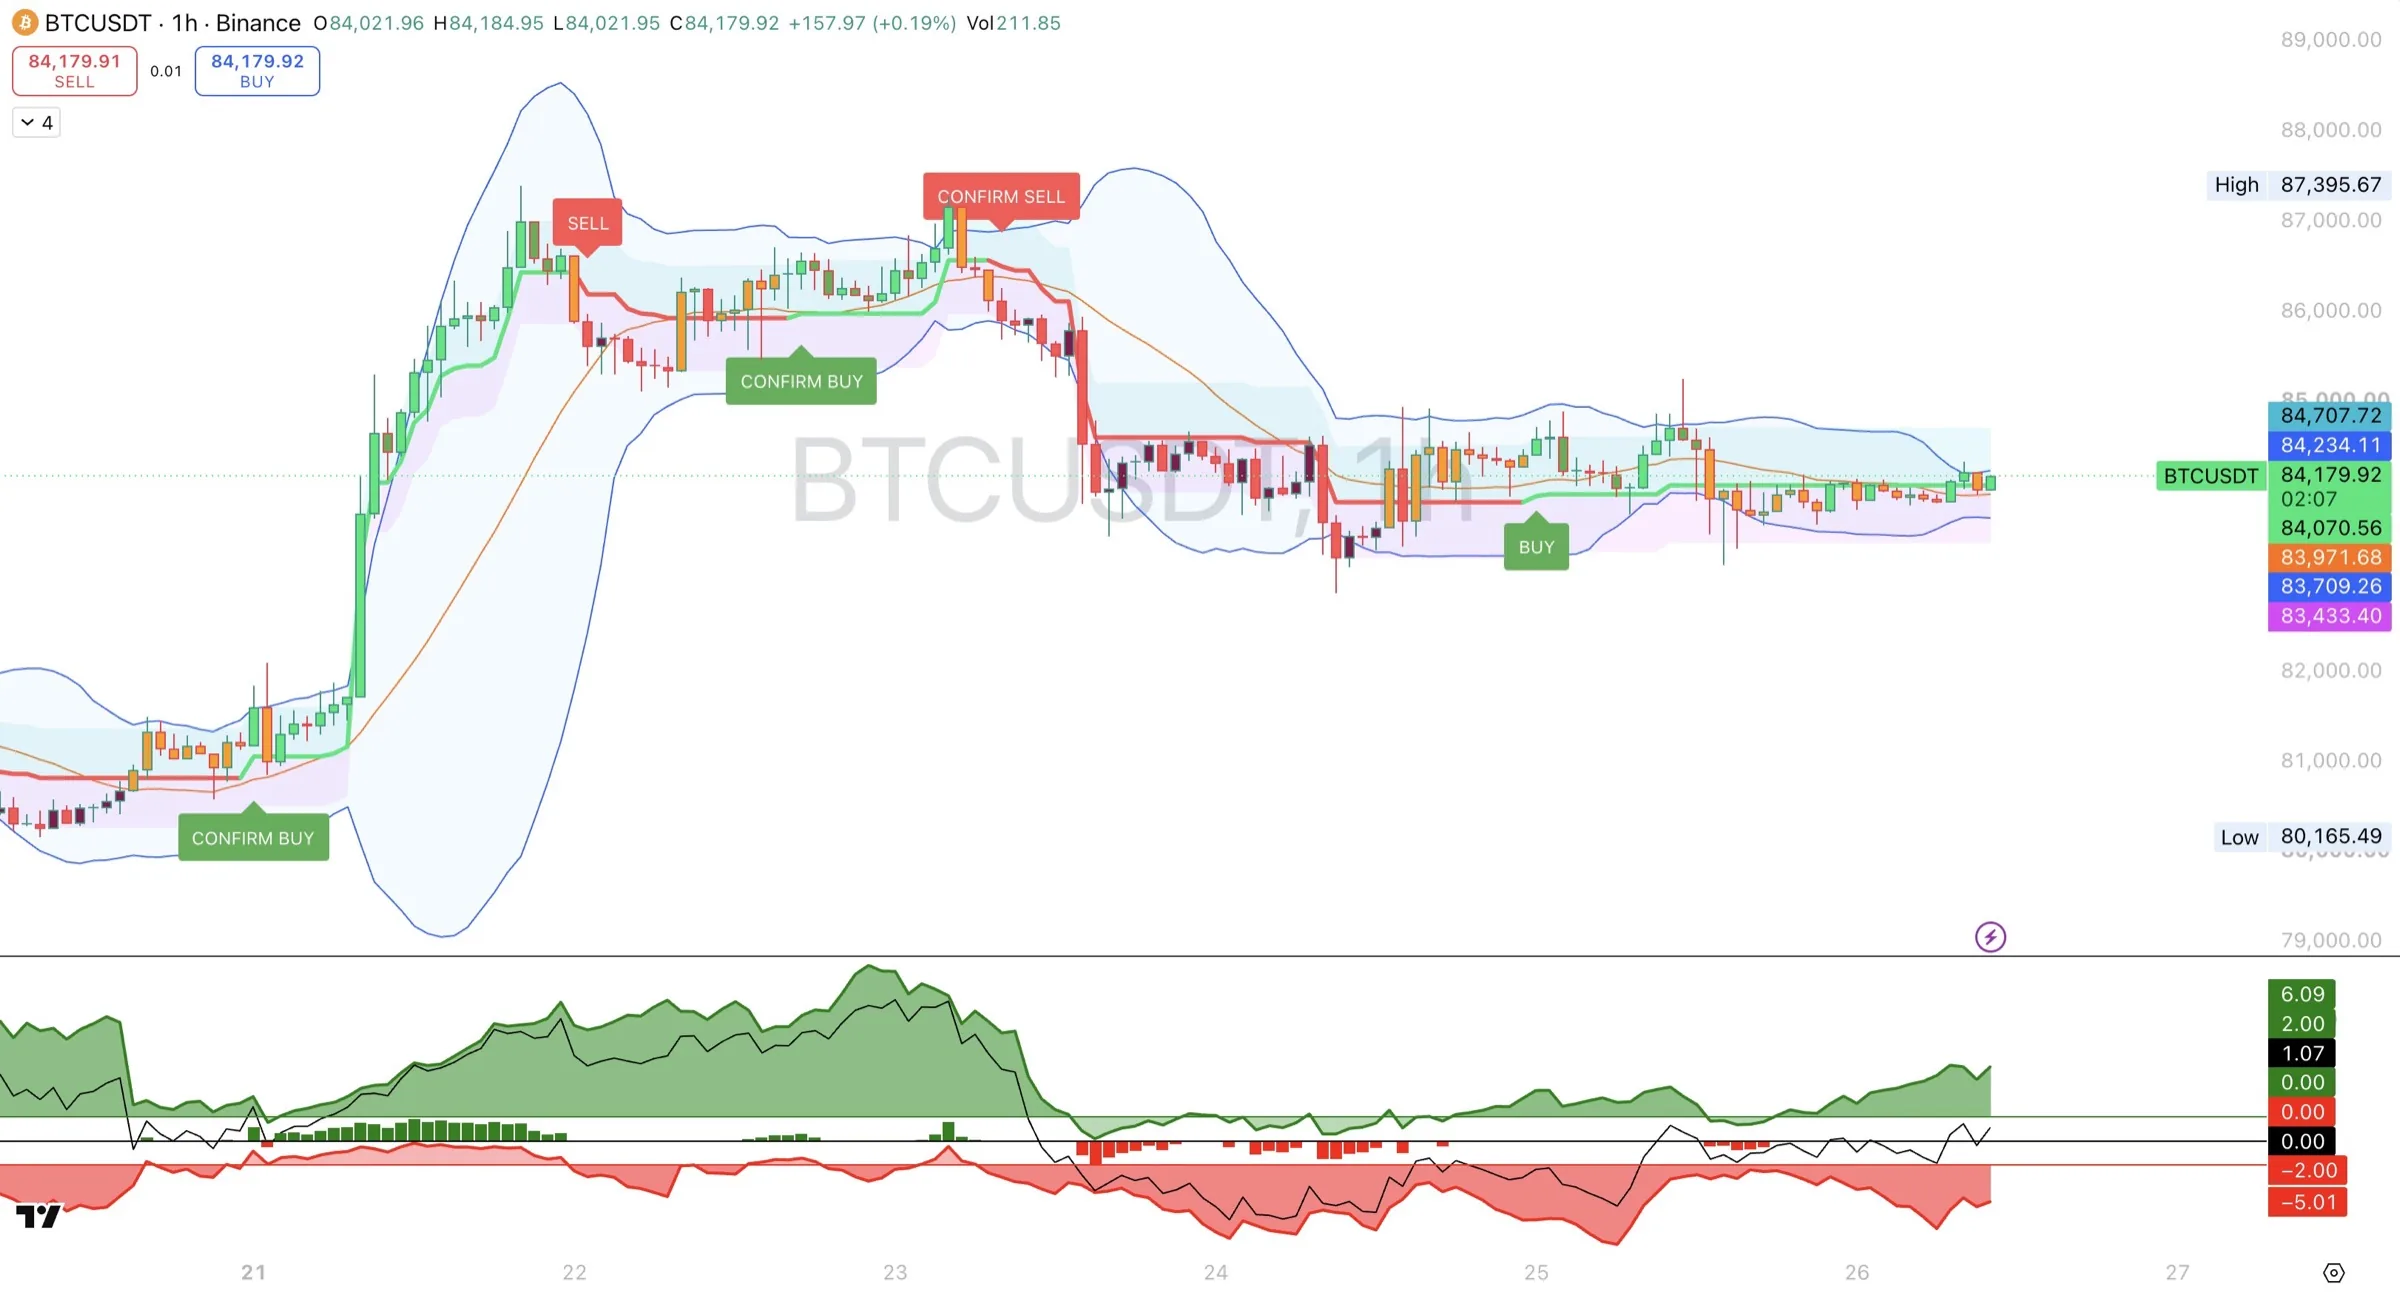
A flat trend line is normal. The line is built to ignore noise, so in quiet or ranging markets it can hold a level for many bars. You can see this on the screenshot on the 23rd to 24th, where the red line runs flat near 84,700 while price chops beneath it, and again on the 25th to 26th, where the green line runs flat near 84,000.
Reading the legend. The values after the indicator name in the chart legend are, in order: Trend line, High Target, Low Target, then the four signal plots (BUY, SELL, CONFIRM BUY, CONFIRM SELL). The signal values read 1 on a bar where that signal fired and 0 otherwise. Hover over any past candle to see its values.
Candle colors replace your own. The indicator recolors candles. If you prefer your normal candle colors, open the indicator settings, go to the Style tab and untick the bar color option.
What the signals mean
BUY / SELL print when the short-term trend changes direction against the broader trend. You get one label per swing, not one on every candle.
CONFIRM BUY / CONFIRM SELL print when the short-term trend changes direction and the broader trend agrees. These are the signals to plan around.
CONFIRM labels print on the same candle as the trend change. They are not a follow-up that arrives after a BUY or SELL.
How to use it
Treat CONFIRM labels as your main signals and plain BUY / SELL labels as early warnings. Everything else on the chart gives you context for those two.
Wait for the candle to close. Signals are calculated on the current candle as it forms. While a candle is still open, a label can appear and then disappear if price moves back. A label is only final once its candle has closed. The same applies to alerts (see Alerts).
CONFIRM BUY / CONFIRM SELL. These are trend flips in the direction of the broader trend, so they are the ones to plan entries around. Look at them alongside structure you already use, such as support and resistance, higher-timeframe direction, or the other Whip modules.
Plain BUY / SELL. These fire when the short-term trend turns against the broader one. On the screenshot, the SELL just after the high on the 22nd came while the broader trend was still up, and it turned out to be a pullback before a CONFIRM BUY. The BUY on the 25th came after a sharp drop while the broader trend was still down, and price went sideways instead of reversing. That is the typical case: a possible turn, but not yet a trend change. Common ways to use them:
- As a heads-up to tighten or take profit on a position in the opposite direction.
- As a watch-list trigger: if price keeps rising, the bounce may be turning into a trend. No CONFIRM BUY will print for that same swing, because the indicator has already flipped bullish, so judge the follow-through yourself.
- As a counter-trend entry only if you trade reversals deliberately and size down for the extra risk.
The trend line. While you are in a trade, the line gives a volatility-adjusted reference. Price holding on the correct side of a line that keeps stepping in your direction means the move is intact. Price crossing back through it is usually the first sign of trouble, and it is what produces the next opposite signal.
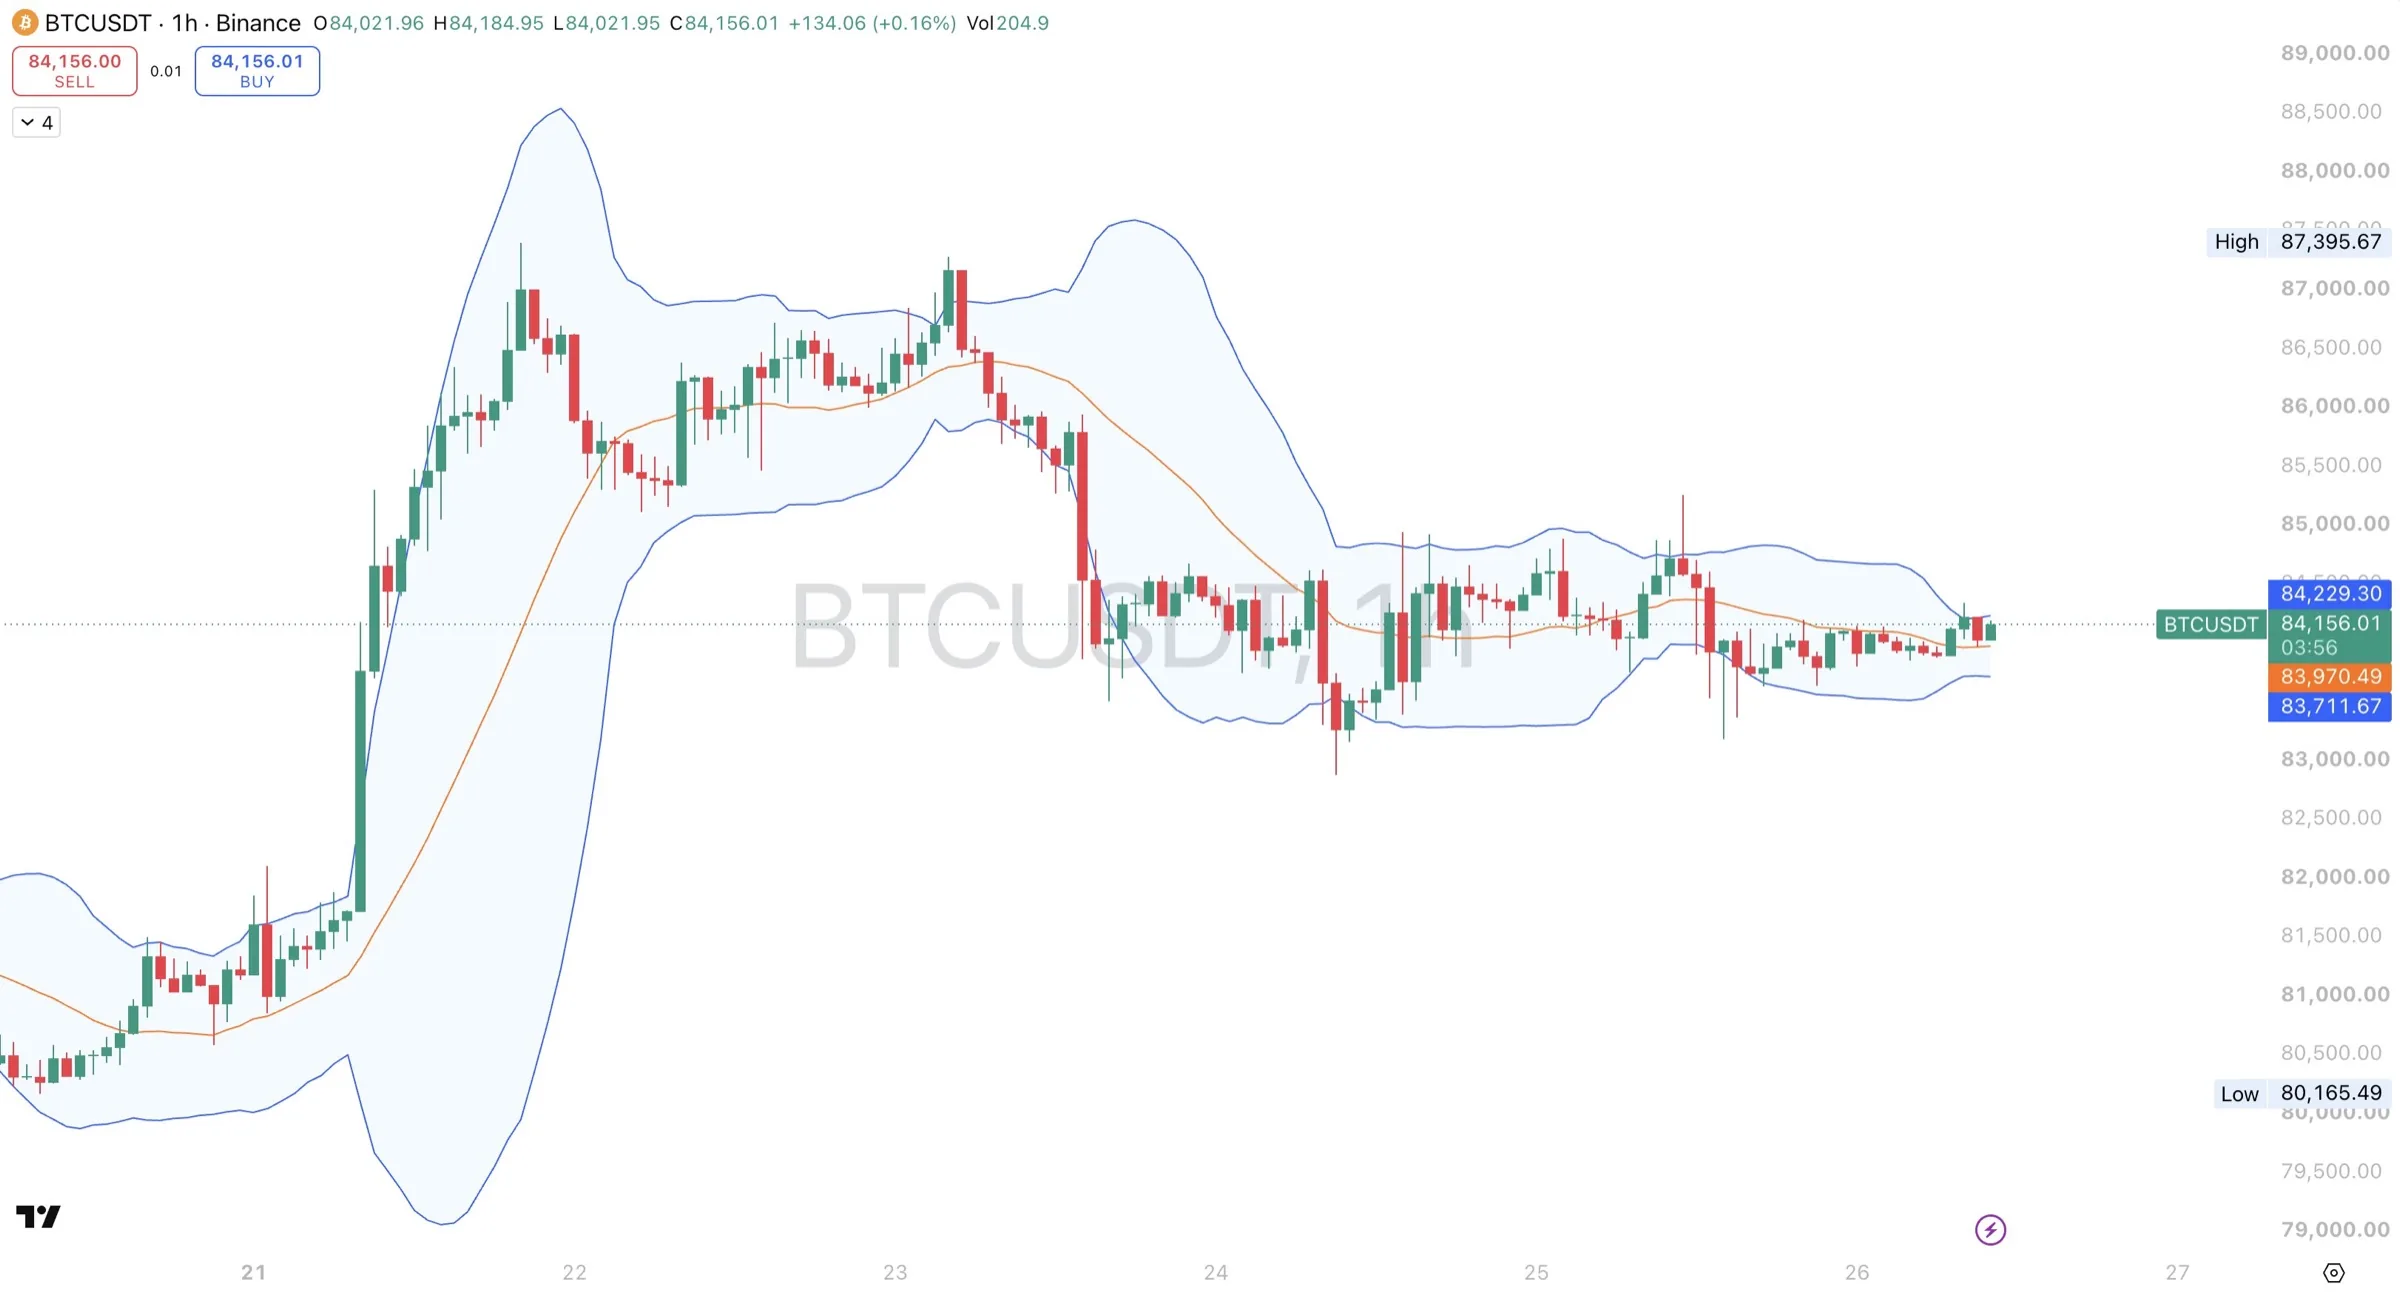
The clouds. The cloud width tells you how volatile the market is right now. Wide clouds mean larger swings, so stops and targets need more room. Price pushing outside the outer edge of a cloud means an unusually strong move relative to recent volatility. That can mean momentum, but it can also mean the move is stretched and due to pause.
Recognising a choppy market. A flat trend line with price swinging back and forth through it, and labels alternating every few candles, is a range. Trend-following signals lose their edge in ranges. Step back, move up a timeframe, or wait for the line to start stepping again.
For a step-by-step routine using 30m, 1H and 4H together, see the multi-timeframe playbook below. Whatever routine you use, decide your stop and position size before entering. The indicator does not set them for you.
Reading the example chart
The screenshot covers about six days of BTCUSDT on the 1-hour chart: a rally from near 81,000 to the 87,395 high, a top that took two attempts, a drop to near 82,900, and a sideways range near 84,000. Reading the labels from left to right:
| Label | Where | What happened next | Lesson |
|---|---|---|---|
| CONFIRM BUY | Near 81,000 on the 21st, after price had been stuck under a flat red line | Price rallied to the 87,395 high in less than a day | A confirmed flip out of a quiet stretch can start a big move. The green line and blue cloud trailed price all the way up. |
| SELL | Around 86,500 on the 22nd, just after the high | Price pulled back to near 85,200 | A plain SELL against a strong uptrend. An early warning to tighten stops, not a new downtrend. |
| CONFIRM BUY | Around 85,900 late on the 22nd | Price climbed back to near 87,200 | The uptrend resumed after the pullback. The flip back to green put buyers back in charge. |
| CONFIRM SELL | Around 86,700 on the 23rd, at the second peak | Price dropped to near 82,900 by the 24th | A confirmed flip at a double top. This one held and caught the main drop. |
| BUY | Around 83,900 on the 25th, after the drop | Price moved sideways between about 83,300 and 84,800 | A plain BUY after a sharp drop. A possible bottom, but no trend change yet, and no CONFIRM followed. |
Three things this chart shows well:
- The big moves started with CONFIRM labels. The rally to the high began with a CONFIRM BUY, and the main drop began with a CONFIRM SELL.
- Plain labels were warnings, not trends. The SELL on the 22nd and the BUY on the 25th both went against the broader trend, and neither turned into a lasting move.
- An early signal can be overruled. The SELL on the 22nd was followed within hours by a CONFIRM BUY. When the opposite label prints, the market has changed its mind, which is why a stop and position size matter on every trade.
Where the chart stands at the right edge. The last label is a plain BUY with no CONFIRM behind it. The green line has run flat near 84,000 for more than a day, and price is sitting just above it inside the clouds. That is a quiet, undecided market. Because the last label was a BUY, the next label will be a SELL or CONFIRM SELL if price turns down. If price breaks higher instead, no new label prints for this swing, so watch for the line to start stepping up and check Trend Core and Channel Pro to confirm the move.
Multi-timeframe playbook: 30m and 1H for early entries, 4H for confirmation
The fastest way to get value from the indicator is to read two timeframes together: 1H (or 30m) to spot the turn early, and 4H to confirm it.
On 1H and 30m, you see the turn first. When the trend flips, the label appears here before anywhere else. While the market is still deciding, it usually shows as a plain BUY or SELL. Once the broader trend lines up, the flip prints as CONFIRM BUY or CONFIRM SELL.
On 4H, you see the confirmed picture. The 4H chart reacts later, and its flips are more often CONFIRM BUY or CONFIRM SELL because the bigger trend has had time to catch up. A plain BUY or SELL can still appear on 4H, so read the label rather than assuming.
| Item | 30m / 1H | 4H |
|---|---|---|
| Best for | Early entries | Confirmed trend entries |
| Typical label at a turn | BUY / SELL, then CONFIRM once the trend agrees | Mostly CONFIRM BUY / CONFIRM SELL |
| Entry price | Closer to the turn, often a better price | Later, often a higher buy or lower sell than the 1H signal |
| Risk | Higher. The turn may not hold. | Lower. The trend has already committed. |
| Signals | More frequent | Fewer, larger moves |
The trade-off in one line: 1H gets you in earlier at a better price but the signal is not confirmed yet. 4H gives you a confirmed signal but you usually pay a little more to get in.
A step-by-step way to use both:
- Open 4H to see the current trend. Note the last label and whether the trend line is stepping up or down.
- Drop to 1H (or 30m) and wait for a new BUY or SELL.
- If you want the early entry: act on the 1H BUY / SELL with a smaller position and a defined stop, and add or hold once 1H prints CONFIRM or 4H flips the same way.
- If you want confirmation: wait for the 4H to print CONFIRM BUY or CONFIRM SELL and enter then, accepting a slightly worse price.
- If 1H and 4H disagree: treat it as a pullback inside the 4H trend, not a new trend. Stay small or stay out.
The same logic works with other pairs of timeframes, for example 15m with 1H for day trading, or 4H with Daily for swing trading.
Example: the same market on 4H. Here is the market from the screenshot above on the 4-hour chart, going back about five weeks.
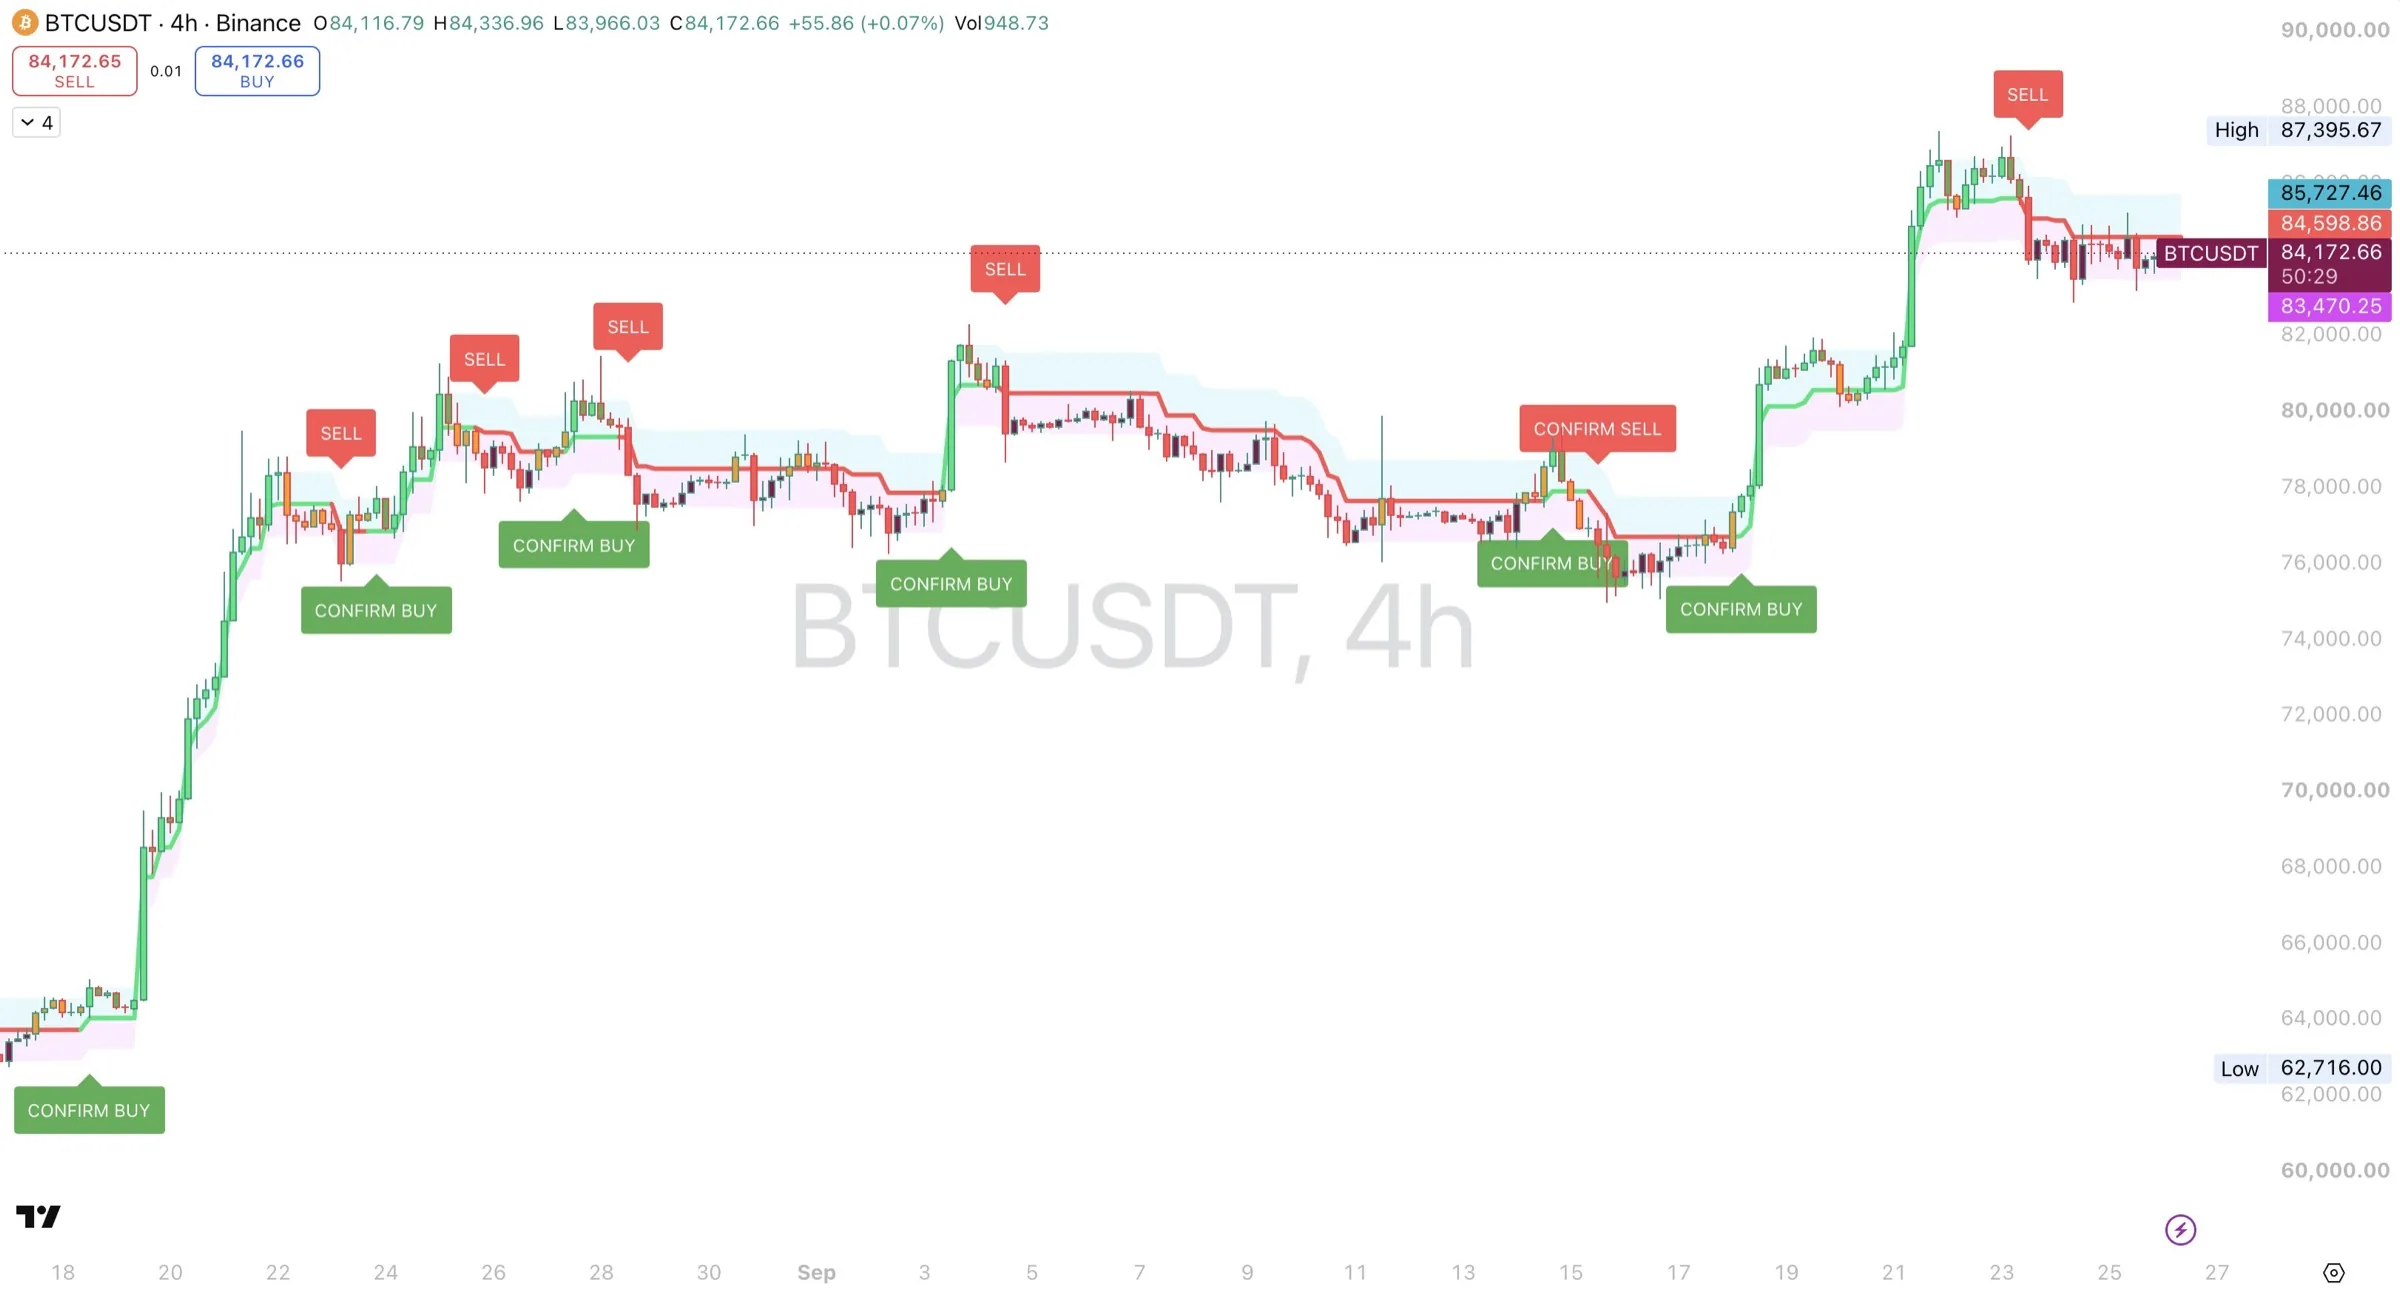
| Label | Where | What happened next | Lesson |
|---|---|---|---|
| CONFIRM BUY | Near 63,500 on Aug 18 | Price rallied to near 79,500 by the 22nd | A confirmed flip out of a quiet base started the biggest move on the chart. |
| SELL, then CONFIRM BUY, three times (Aug 23 to 28) | SELLs near 78,500, 80,500 and 80,000, each after a push higher | Each SELL was followed by a pullback of a few thousand, then a CONFIRM BUY | In a strong uptrend, plain SELLs marked pullbacks. The CONFIRM BUYs after them were re-entry points. |
| CONFIRM BUY | Near 77,000 on Sep 3 | Price jumped to near 82,000 | Buyers stepped back in at the bottom of the range. |
| SELL | Near 82,000 on Sep 4 | Price slid slowly to near 76,000 over the next ten days, and no CONFIRM SELL followed | A plain SELL can start a real downtrend. Because the indicator is already bearish, no CONFIRM SELL prints for that swing, so judge the follow-through yourself. |
| CONFIRM BUY, then CONFIRM SELL a day later | Near 77,000 on Sep 14, then near 78,500 on Sep 15 | Price fell to the 74,968 low | Opposite CONFIRM labels a day apart mean a choppy market. Stay out until one side takes control. |
| CONFIRM BUY | Near 76,500 on Sep 18 | Price rallied to 87,395 by the 22nd | The flip that started the rally shown on the 1H chart. |
| SELL | Near 87,000 on Sep 23 | Price pulled back to near 84,000 | Only a plain SELL on 4H. The bigger uptrend is still intact. |
At the right edge, the 4H line is red near 84,600 with price just below it, and the clouds run from about 83,500 to 85,700.
And on 30m. Here is the same market on the 30-minute chart, covering the 22nd to the 26th.
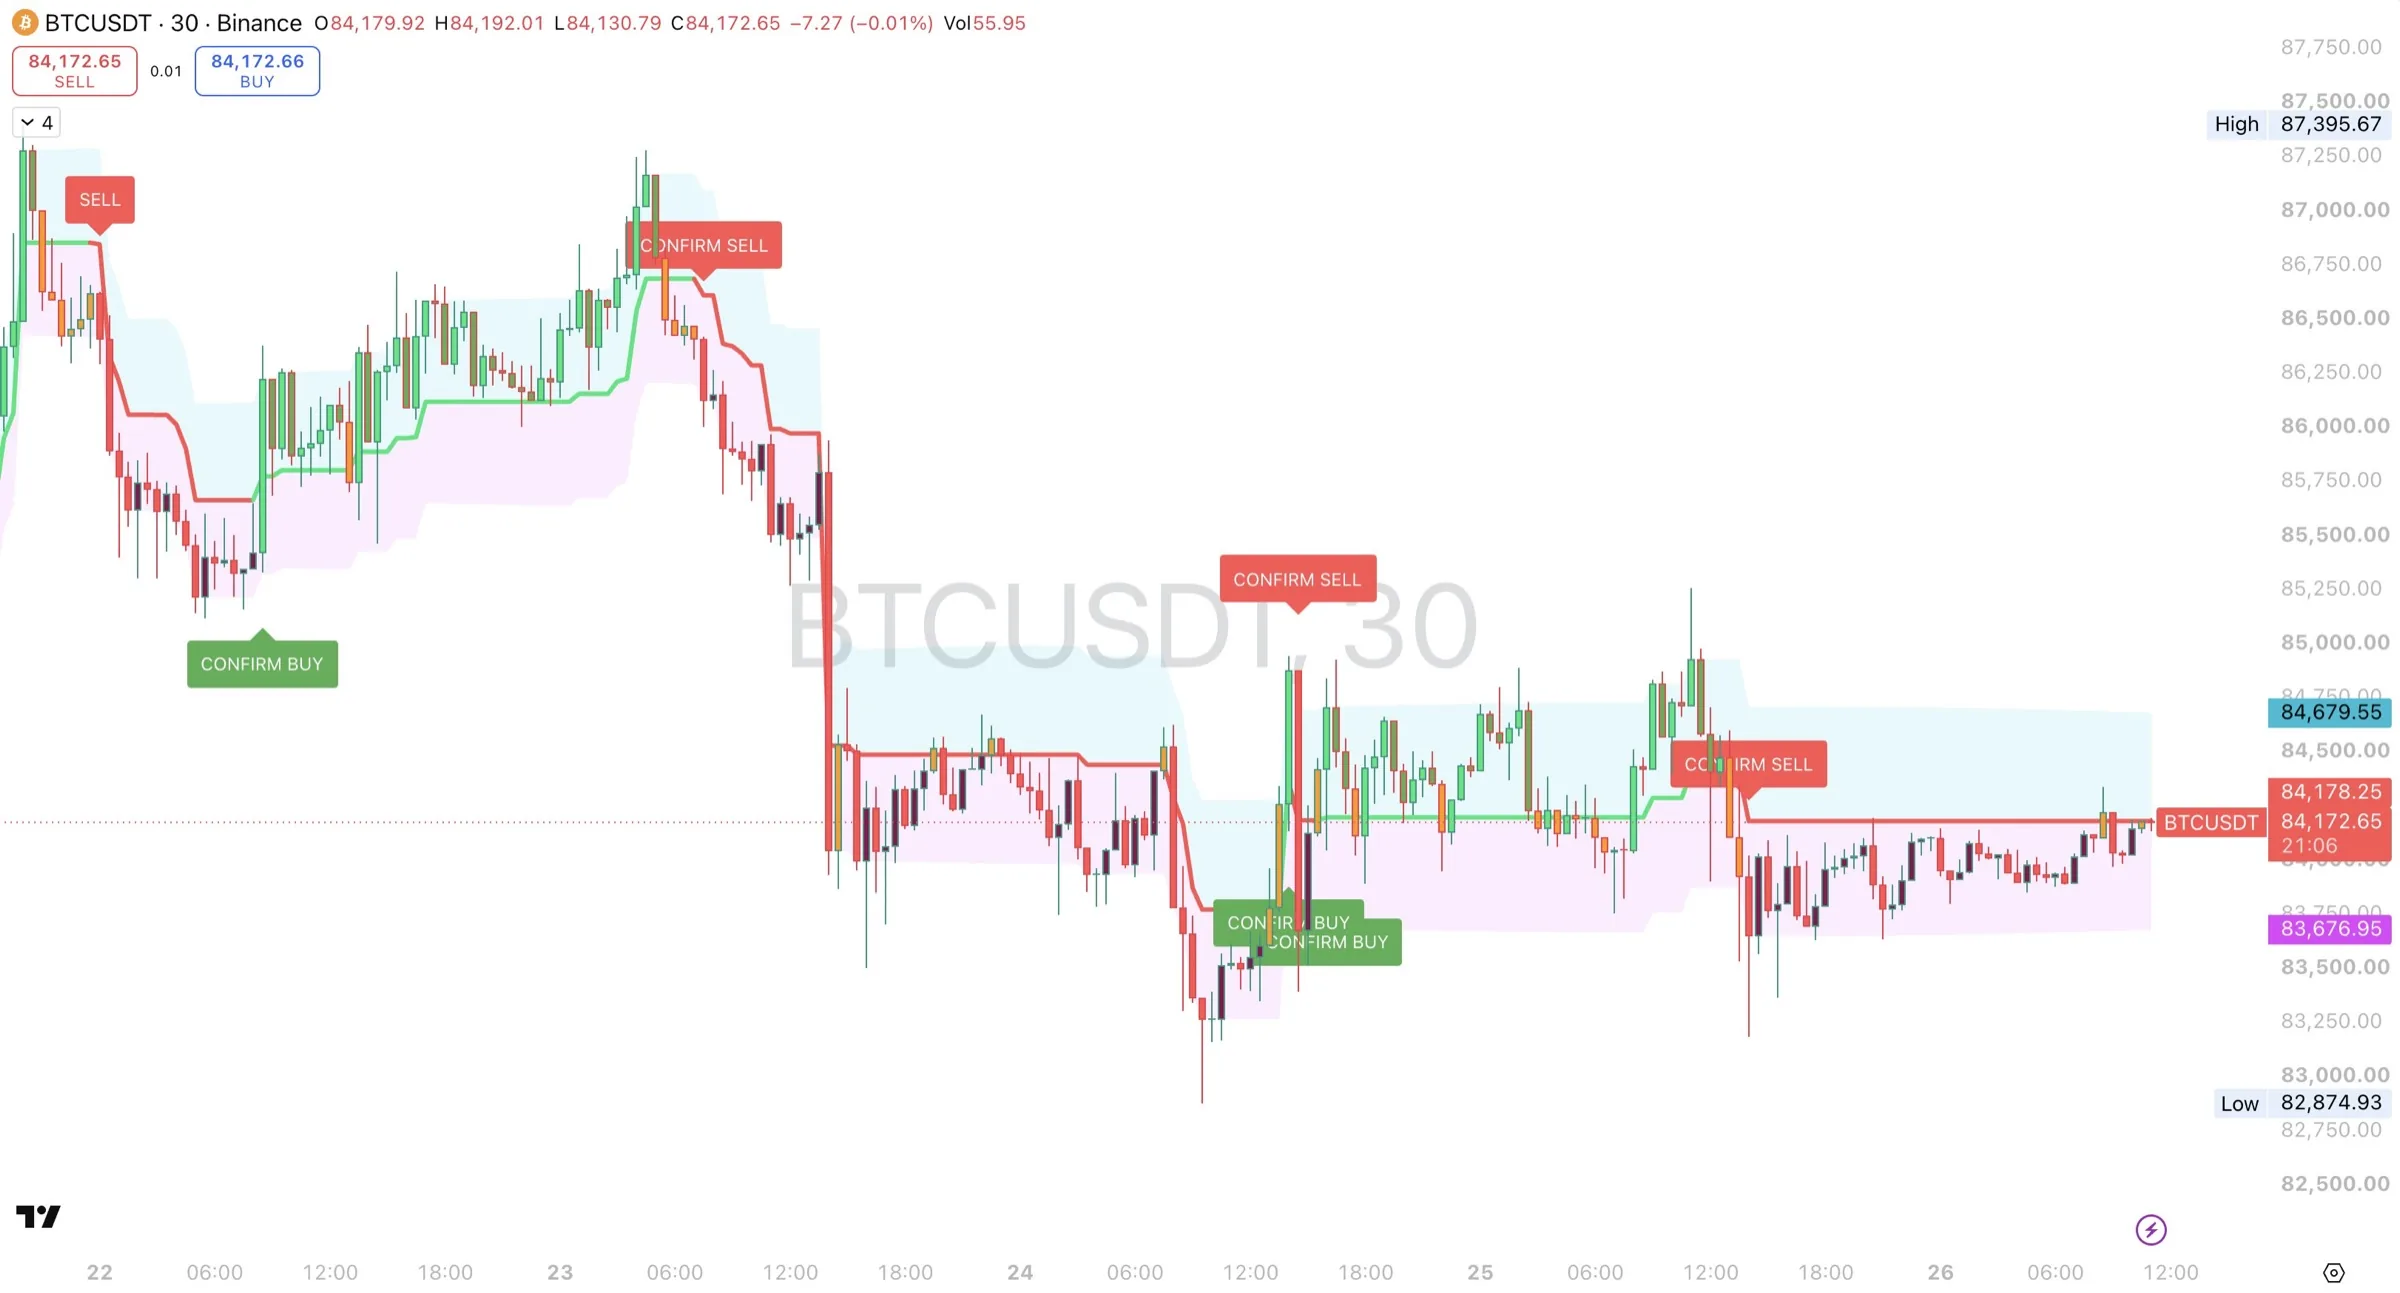
| Label | Where | What happened next | Lesson |
|---|---|---|---|
| SELL | Near 87,000, just after midnight on the 22nd | Price pulled back to near 85,300 | A plain SELL against the uptrend. A pullback. |
| CONFIRM BUY | Near 85,300 on the morning of the 22nd | Price climbed back to near 87,300 | The uptrend resumed. |
| CONFIRM SELL | Near 86,800 on the morning of the 23rd | Price fell to the 82,875 low on the 24th | The top, caught on 30m at about the same time as on 1H. |
| CONFIRM BUY, CONFIRM SELL, CONFIRM BUY | All near 83,700 to 85,000, within about two hours on the afternoon of the 24th | Price swung wildly between about 83,300 and 84,900 | A whipsaw. Labels flipping this fast mean the market is too volatile to read. |
| CONFIRM SELL | Near 84,500 on the afternoon of the 25th, after a rejection near 85,300 | Price dipped to near 83,300, then went sideways | A short drop back into the range. |
At the right edge, the 30m line is red and flat near 84,200, with price sitting right on it.
Comparing all three timeframes:
| Item | 30m | 1H | 4H |
|---|---|---|---|
| The top on the 23rd | CONFIRM SELL near 86,800 | CONFIRM SELL near 86,700 | Plain SELL near 87,000 |
| The bottom on the 24th to 25th | CONFIRM BUY near 83,700 on the 24th | Plain BUY near 83,900 on the 25th | No new label |
| Labels printed | 7 in about four days | 5 in about six days | 12 in about five weeks |
| Last label now | CONFIRM SELL | BUY | SELL |
What this shows:
- Faster timeframes see turns sooner. 30m caught the bottom almost a day before 1H, and as a CONFIRM rather than a plain BUY.
- Faster timeframes are noisier. 30m printed three labels in two hours on the 24th. 4H only printed one label in the whole drop, and it was a plain SELL.
- The bigger timeframe decides what a move means. The drop on the 23rd was a confirmed downtrend on 30m and 1H, but only a pullback on 4H.
- Right now, the timeframes disagree. 30m and 4H are on a SELL, 1H is on a BUY, and none has a confirmed signal the others agree with. Wait.
A simple rule: decide direction on 4H, confirm it on 1H, and use 30m only to time an entry in that direction.
Using it with the other Whip modules
Each Whip module answers a different question. Read together, they give you a complete picture before you take a trade.
| Module | Question it answers | What you look at |
|---|---|---|
| Whip Trend Confirmation | Has the trend flipped, and is the flip confirmed? | BUY / SELL and CONFIRM BUY / CONFIRM SELL labels |
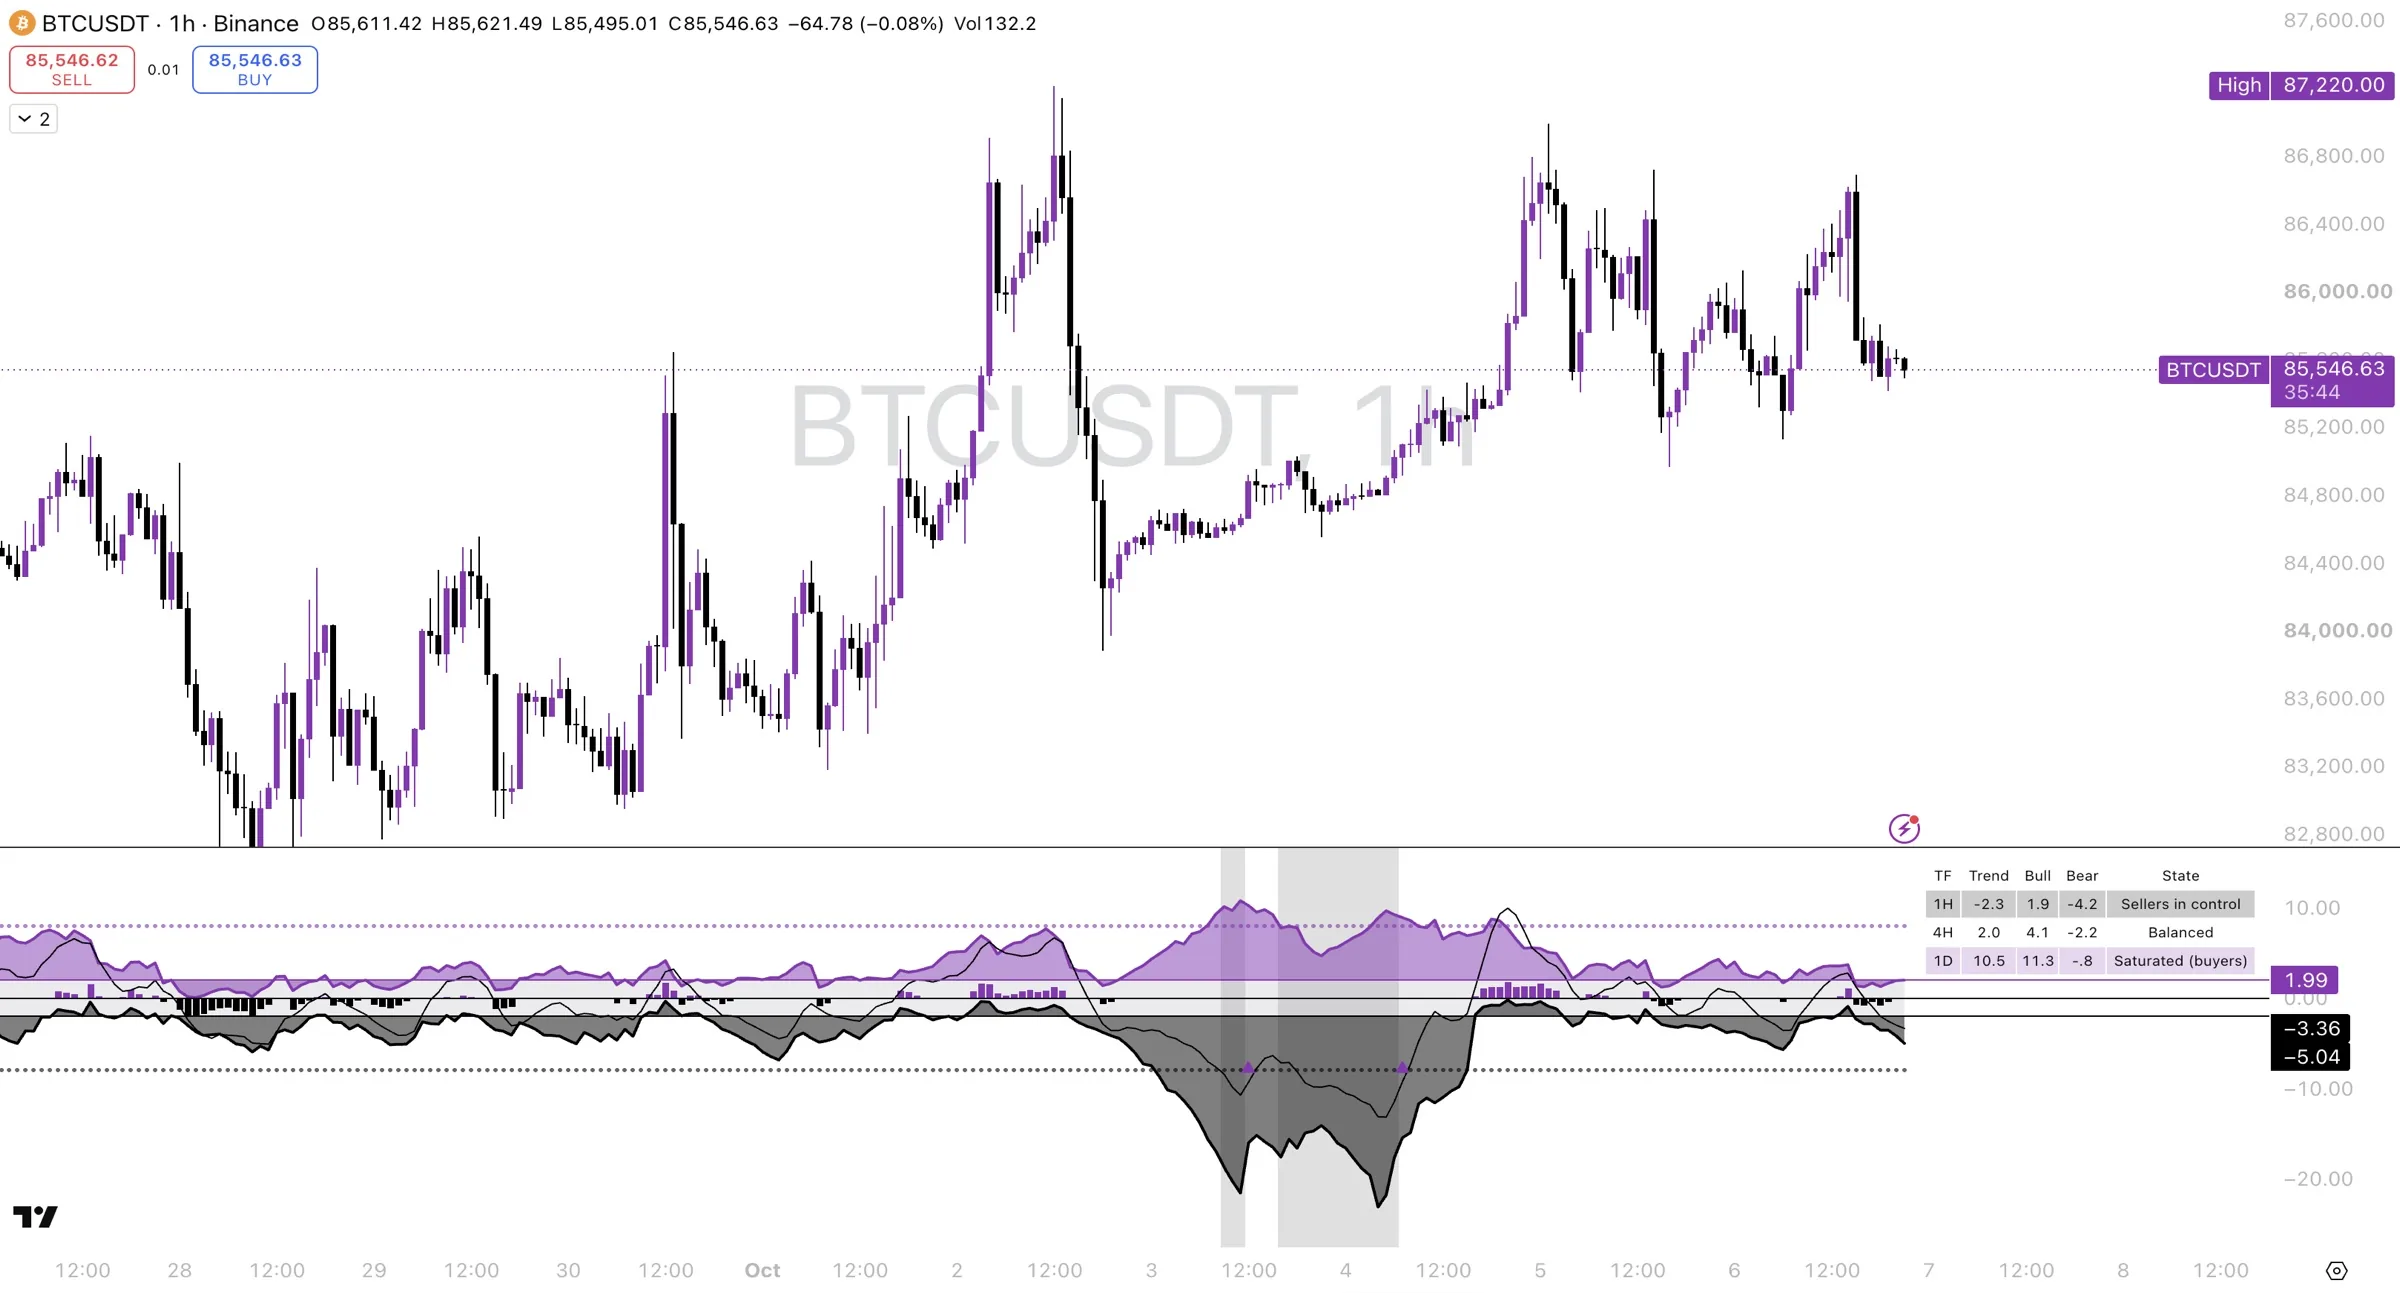
| Whip Trend Core | How strong is the trend, and is it saturated? | The Trend line value, its direction, and the columns |
| Whip Channel Pro | Where is price within its volatility boundaries, and is the market expanding or contracting? | The channel boundaries and zones |
With Whip Trend Core. Trend Confirmation tells you when the trend flips. Trend Core tells you how much strength is behind it. Before acting on a label, check the Trend Core value on the same timeframe:
| Label | Trend Core | What it usually means |
|---|---|---|
| CONFIRM BUY | Rising through 0 or above +2 | Strong setup. Signal and strength agree. |
| CONFIRM BUY | Already around +8 to +10 | Late. The move is stretched. Size down or wait. |
| CONFIRM SELL | Falling through 0 or below -2 | Strong setup. Signal and strength agree. |
| CONFIRM SELL | Already around -8 to -10 | Late. The move is stretched. Size down or wait. |
| BUY after a big drop | Around -8 to -10 and turning up | Sellers exhausted. Early reversal attempt. |
| SELL after a big rally | Around +8 to +10 and turning down | Buyers exhausted. Early reversal attempt. |
A useful pattern: after a SELL or CONFIRM SELL and a big drop, a Trend Core reading around -8 to -10 means the down move is saturated and a flip to BUY or CONFIRM BUY is getting more likely. Check both indicators on 1H and 4H. The first BUY on 1H is the early signal, and a CONFIRM BUY on 4H is the confirmed one. The same works in reverse after a rally. A saturated reading does not time the flip, so always wait for the label.
With Whip Channel Pro. Use Channel Pro to judge location: whether price has room to move in the direction of your signal, or is already stretched to a boundary. A CONFIRM label with room to run is a better entry than the same label with price pressed against a boundary.
A simple order to read them in: Trend Core for strength, Trend Confirmation for timing, Channel Pro for location. The more the three agree, the stronger the setup. When they disagree, wait, trade smaller, or skip it.
For the full workflow using all three modules together, see the Whip System Complete Guide.
Alerts
The indicator offers four alert conditions:
| Alert | Fires when |
|---|---|
| Confirmed Buy Alert | A bullish trend change that agrees with the broader trend. |
| Confirmed Sell Alert | A bearish trend change that agrees with the broader trend. |
| Buy Alert | Any bullish flip, confirmed or not. |
| Sell Alert | Any bearish flip, confirmed or not. |
Buy Alert and Sell Alert fire on every flip, including the confirmed ones. If you only want confirmed setups, create the two Confirmed alerts and skip the others. If you create both types, expect two notifications on every confirmed signal.
To set one up:
- Add the indicator to your chart and pick the symbol and timeframe you want to watch.
- Open the Alerts panel and click Create alert (or press Alt+A).
- Under Condition, choose Whip Trend Confirmation, then the alert you want.
- Set the trigger to Once per bar close. With other options, an alert can fire on a signal that disappears before the candle closes.
- Choose how you want to be notified (app, email, webhook) and save.
Each alert is tied to one symbol and one timeframe. Watching several markets means one alert per market.
- TradingViewnowWhip Trend ConfirmationConfirmed Buy Alert · NQ1! · 1H
- TradingView12m agoWhip Channel Pro + S/RPrice crossed R1 1H/4H at 84,700
- TradingView1h agoWhip Trend CoreTrend crossing down -10 · XAUUSD · 4H
Settings
| Setting | Default | What it changes |
|---|---|---|
| Source | close | The price the trend line follows. Close is the standard choice. hl2 or hlc3 smooth it slightly. |
| Sampling Period | 100 | How much history the indicator uses to judge normal market conditions. Higher values adapt more slowly. |
| Range Multiplier | 3.0 | Sensitivity. Lower values make the line more responsive and give more signals. Higher values make it smoother and give fewer, later signals. |
| Trend Indicator Source | close | The price used for the broader trend check behind CONFIRM signals. |
Keep Source and Trend Indicator Source the same unless you have a specific reason to split them.
The Style tab lets you change colors and turn off any element, including the clouds, candle colors, and either set of labels.
Timeframes, markets and tuning
The defaults (Sampling Period 100, Range Multiplier 3.0) are fairly slow and aim for swing-sized moves. They work as a starting point on every market and timeframe because the indicator adjusts to each market's own conditions.
When you want to adjust, change one setting at a time and compare on history before trading it:
- Too many signals or constant flipping: raise the Range Multiplier (for example 3.5 to 4). Signals become fewer and smoother.
- Signals arriving too late: lower the Range Multiplier (for example 2 to 2.5). You will catch turns earlier and get more false flips in return.
- Volatility regime changes a lot (news-driven markets, new listings): a lower Sampling Period lets the indicator adapt faster. A higher one keeps it steady.
Lower timeframes (1m to 15m) produce more signals and more noise. Higher timeframes (4h and up) produce fewer signals that tend to cover larger moves. Many traders read the higher timeframe for direction and take signals on the lower one.
The indicator needs a few hundred bars of history before its values settle. On a newly listed symbol, or when you have scrolled to the very start of the data, ignore the early bars.
Limitations
Know these before you rely on the signals:
- It lags by design. The line only turns after price has already moved. You will never catch the exact top or bottom.
- It struggles in ranges. Sideways markets produce back-and-forth flips. The trend check cuts some of these out, but not all.
- Signals are final only at candle close. Anything you see on the open candle can still change.
- It works on closing prices by default. A wick that spikes through the line and snaps back before the close will not trigger a signal.
- Sharp reversals can skip confirmation. After a fast crash or squeeze, price often turns before the broader trend catches up. The first flip then prints as a plain BUY or SELL, and no CONFIRM label follows for that swing.
- Gaps. On stocks and indices, overnight and weekend gaps can move price well past the line in one bar and produce a signal well after the move started.
- Past signals do not predict future ones. A chart full of well-placed labels says nothing certain about the next one.
FAQ
Getting started
What does Trend Confirmation tell me?
When the trend has flipped, and whether the bigger trend agrees. You get one label per swing: BUY or SELL for early flips, CONFIRM BUY or CONFIRM SELL for confirmed ones.
What is the fastest way to learn to read it?
Go through the example charts in this guide: the 1H walkthrough, then the 4H and 30m tables in the multi-timeframe playbook. Then scroll back through your own market's chart and read each label the same way: where it printed, what happened next, and whether it was plain or CONFIRM.
Do I need to change the settings?
No. The defaults work on every market and timeframe. Adjust only if you want more or fewer signals, and test on past charts first.
Can I use it on its own?
Yes. It works as a standalone tool, and pairs well with Whip Trend Core for strength and Whip Channel Pro for location.
Reading signals
Should I trade BUY / SELL or CONFIRM BUY / CONFIRM SELL?
CONFIRM signals are the stronger setups and the ones to build a plan around. Plain BUY / SELL catch the turn sooner and at a better price, but the bigger trend has not agreed yet. Many traders use them as a heads-up and wait for a CONFIRM label or the 4H before committing full size.
Are plain BUY / SELL labels always just pullbacks?
No. On the 1H example, the SELL on the 22nd was a pullback and was followed by a CONFIRM BUY within hours. But on the 4H example, the plain SELL on Sep 4 started a ten-day slide from about 82,000 to 76,000. A plain label is an early signal. Sometimes the move keeps going, so judge the follow-through with the trend line, Trend Core and the higher timeframe.
I got a BUY but no CONFIRM BUY followed. Why?
A CONFIRM label only prints at the moment the trend changes. If the bigger trend was still pointing the other way at that moment, you get a plain BUY, and no CONFIRM BUY will appear later for that same swing. The next label will be a SELL or CONFIRM SELL. Check the 4H chart for confirmation instead.
Why did I get a CONFIRM BUY and then a CONFIRM SELL right after it?
The market is choppy. On the 4H example this happened on Sep 14 to 15, and on the 30m example three CONFIRM labels printed within two hours on the 24th. When labels flip back and forth like that, there is no trend to follow. Stay out until the line starts stepping steadily in one direction.
What do the line colors mean?
Green means the trend line is stepping up, red means it is stepping down, and orange means no direction has been established yet. A flat line of either color means the market is quiet.
What do the clouds tell me?
How volatile the market is right now. Wide clouds mean bigger swings, so stops and targets need more room. Price pushing past the outer edge of a cloud means an unusually strong move, which can mean momentum or a move that is stretched.
Where should I put my stop?
The indicator does not set stops. Many traders place them beyond the trend line or the far edge of the cloud, so normal swings do not knock them out. Decide your stop and position size before you enter.
Timeframes
Which timeframe should I use?
Use more than one. A simple rule: decide direction on 4H, confirm it on 1H, and use 30m only to time the entry.
Why is my 4H entry at a worse price than the 1H signal?
The 4H chart waits for the move to prove itself before it confirms. That costs you part of the move. On the example, the 1H CONFIRM BUY came near 81,000, but the rally had started from the 4H CONFIRM BUY near 76,500 three days earlier.
Why do the timeframes show different labels right now?
Because they measure different-sized trends. At the right edge of the examples, 30m and 4H are on a SELL and 1H is on a BUY. None has a confirmed signal the others agree with, which means wait.
Is 30m better because it is faster?
Faster, not better. On the example, 30m caught the bottom almost a day before 1H, but it also printed three labels in two hours during the whipsaw on the 24th. Use it for timing, not for deciding direction.
Technical
Does it repaint?
Labels on the candle that is still forming can appear and disappear as price moves. Once a candle closes, its label is final and does not change. Always act on closed candles and set alerts to Once per bar close.
Why is the trend line flat?
The market is quiet or moving sideways. Signals in these stretches are less reliable. Wait for the line to start stepping again.
Can I get signals on my phone?
Yes. Create a TradingView alert on the indicator and turn on app notifications. See the Alerts section.
Why do I get two alerts for one signal?
Buy Alert and Sell Alert fire on every flip, including confirmed ones. If you also set the Confirmed alerts, a confirmed signal triggers both. Use only the Confirmed alerts if you want one notification per setup.
What is the win rate?
We do not publish a win rate, because results depend on the market, timeframe, entries, exits and risk management you use. Scroll back through history on your own markets to see how the signals behave before trading them live.
Access
How do I get access?
It is an invite-only script. Buy access at whipalgo.com, or request access at whipalgo.com/contact.
Disclaimer and access
Disclaimer. This indicator does not predict future price movement and does not guarantee any result. We are not financial advisors. It is provided for educational and technical analysis purposes only. Use it alongside your own analysis and proper risk management, and never risk money you cannot afford to lose.
Access. Whip Trend Confirmation is an invite-only script on TradingView. To buy access, go to whipalgo.com. To request access or ask a question, go to whipalgo.com/contact. Once access is granted, find it under Indicators, then the Invite-only scripts tab, and add it to your chart.