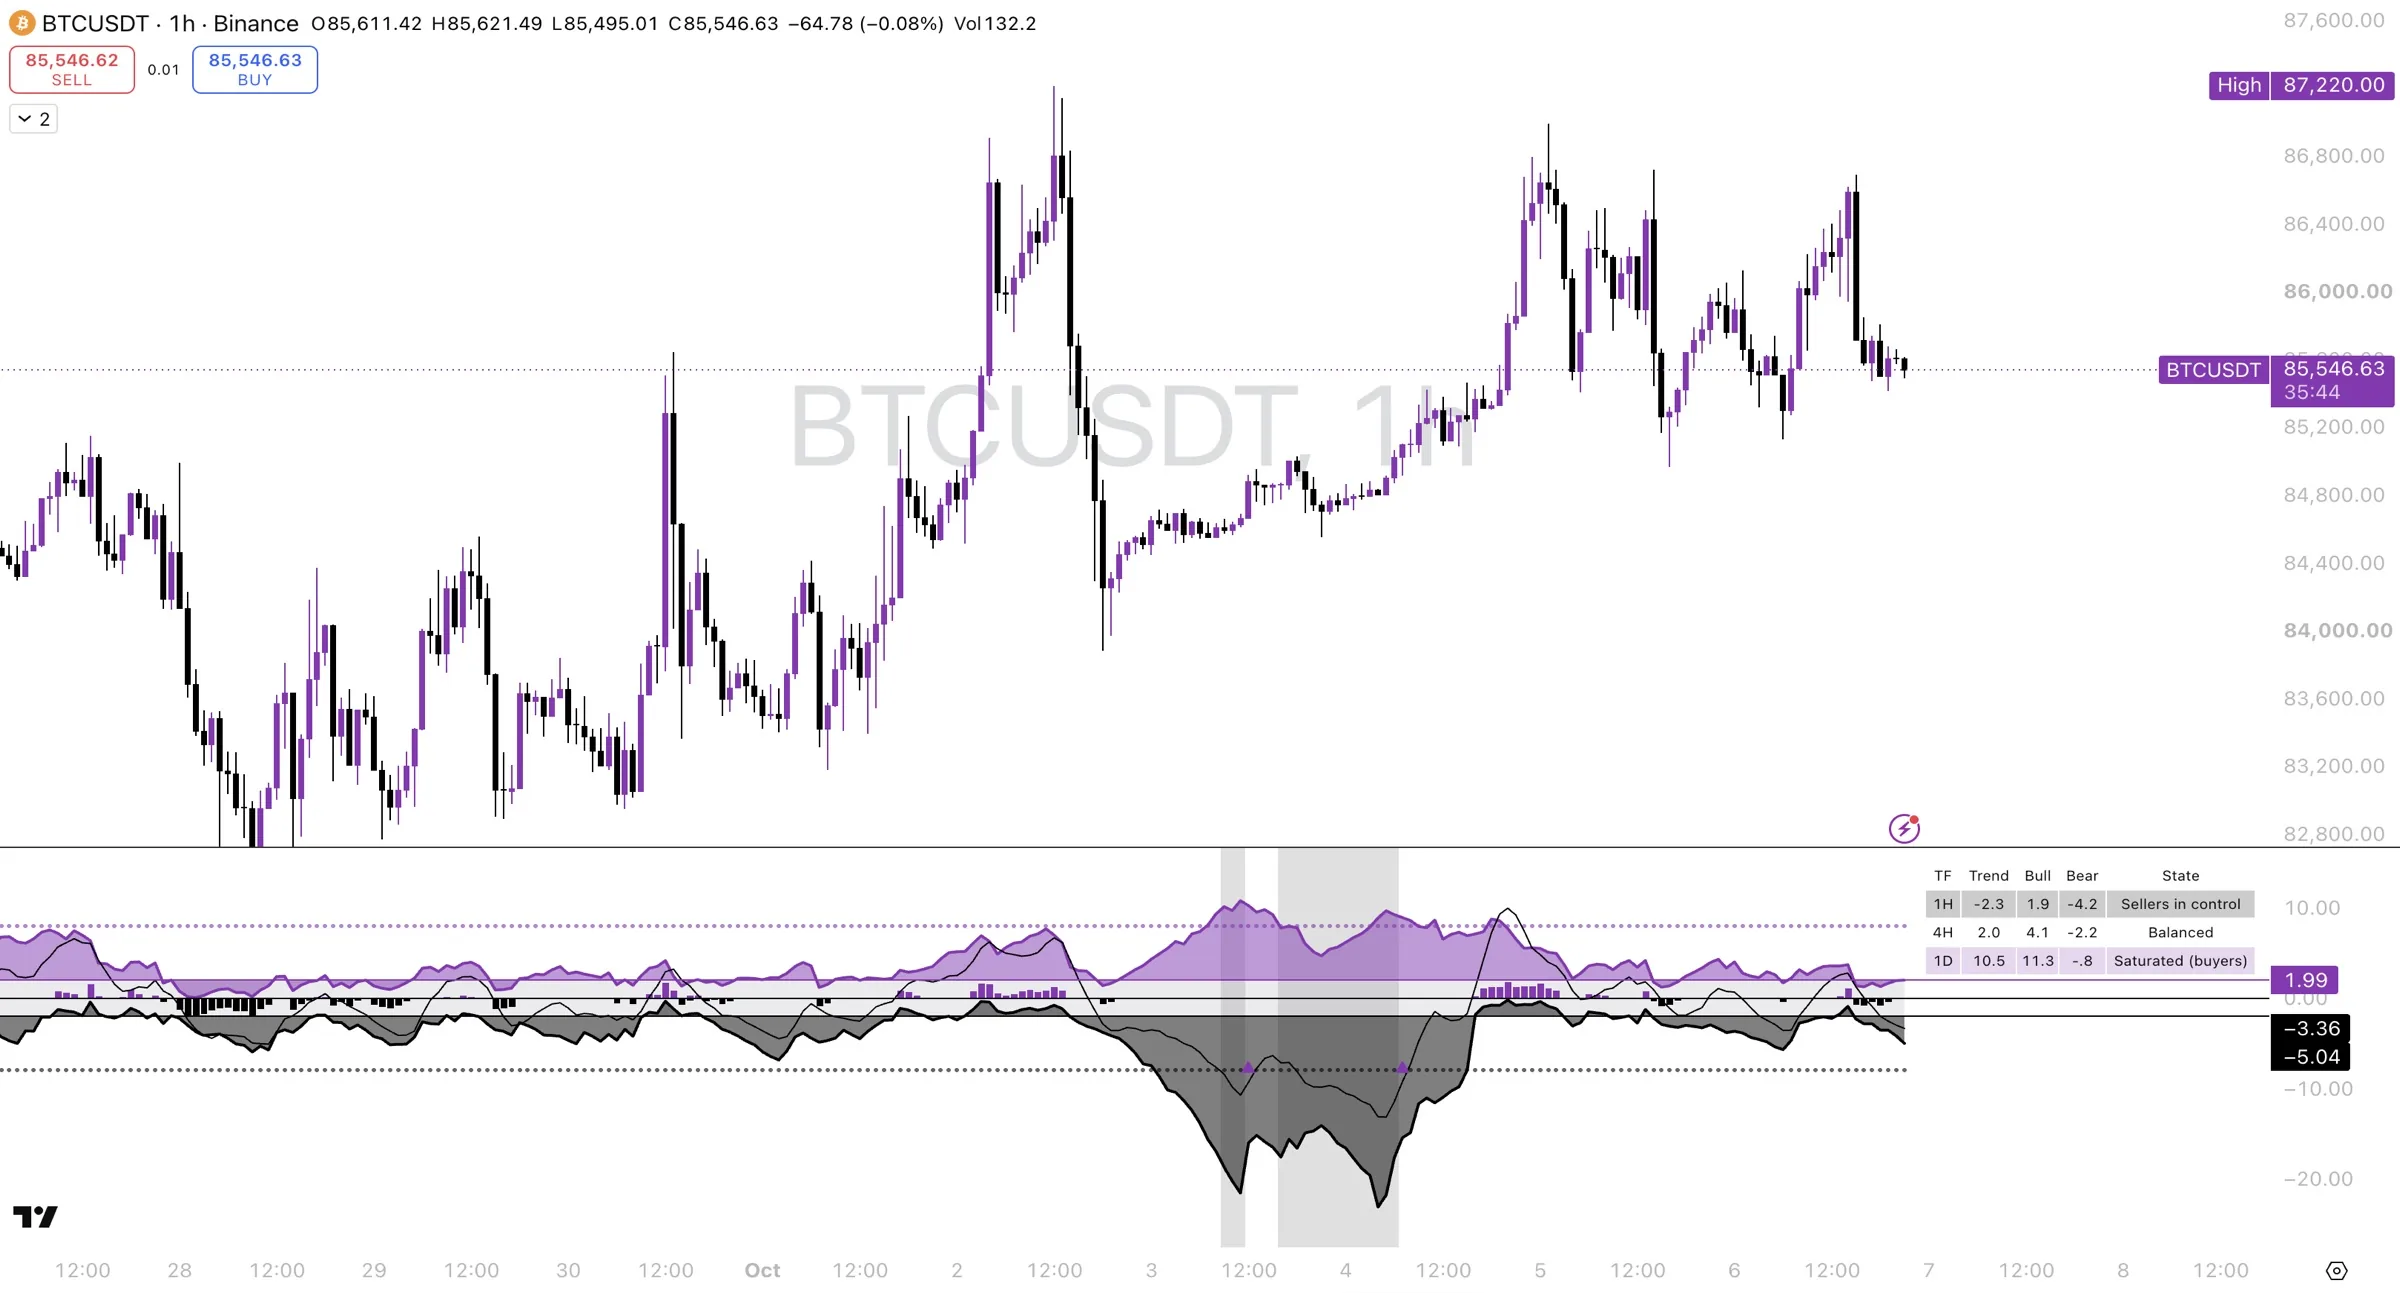
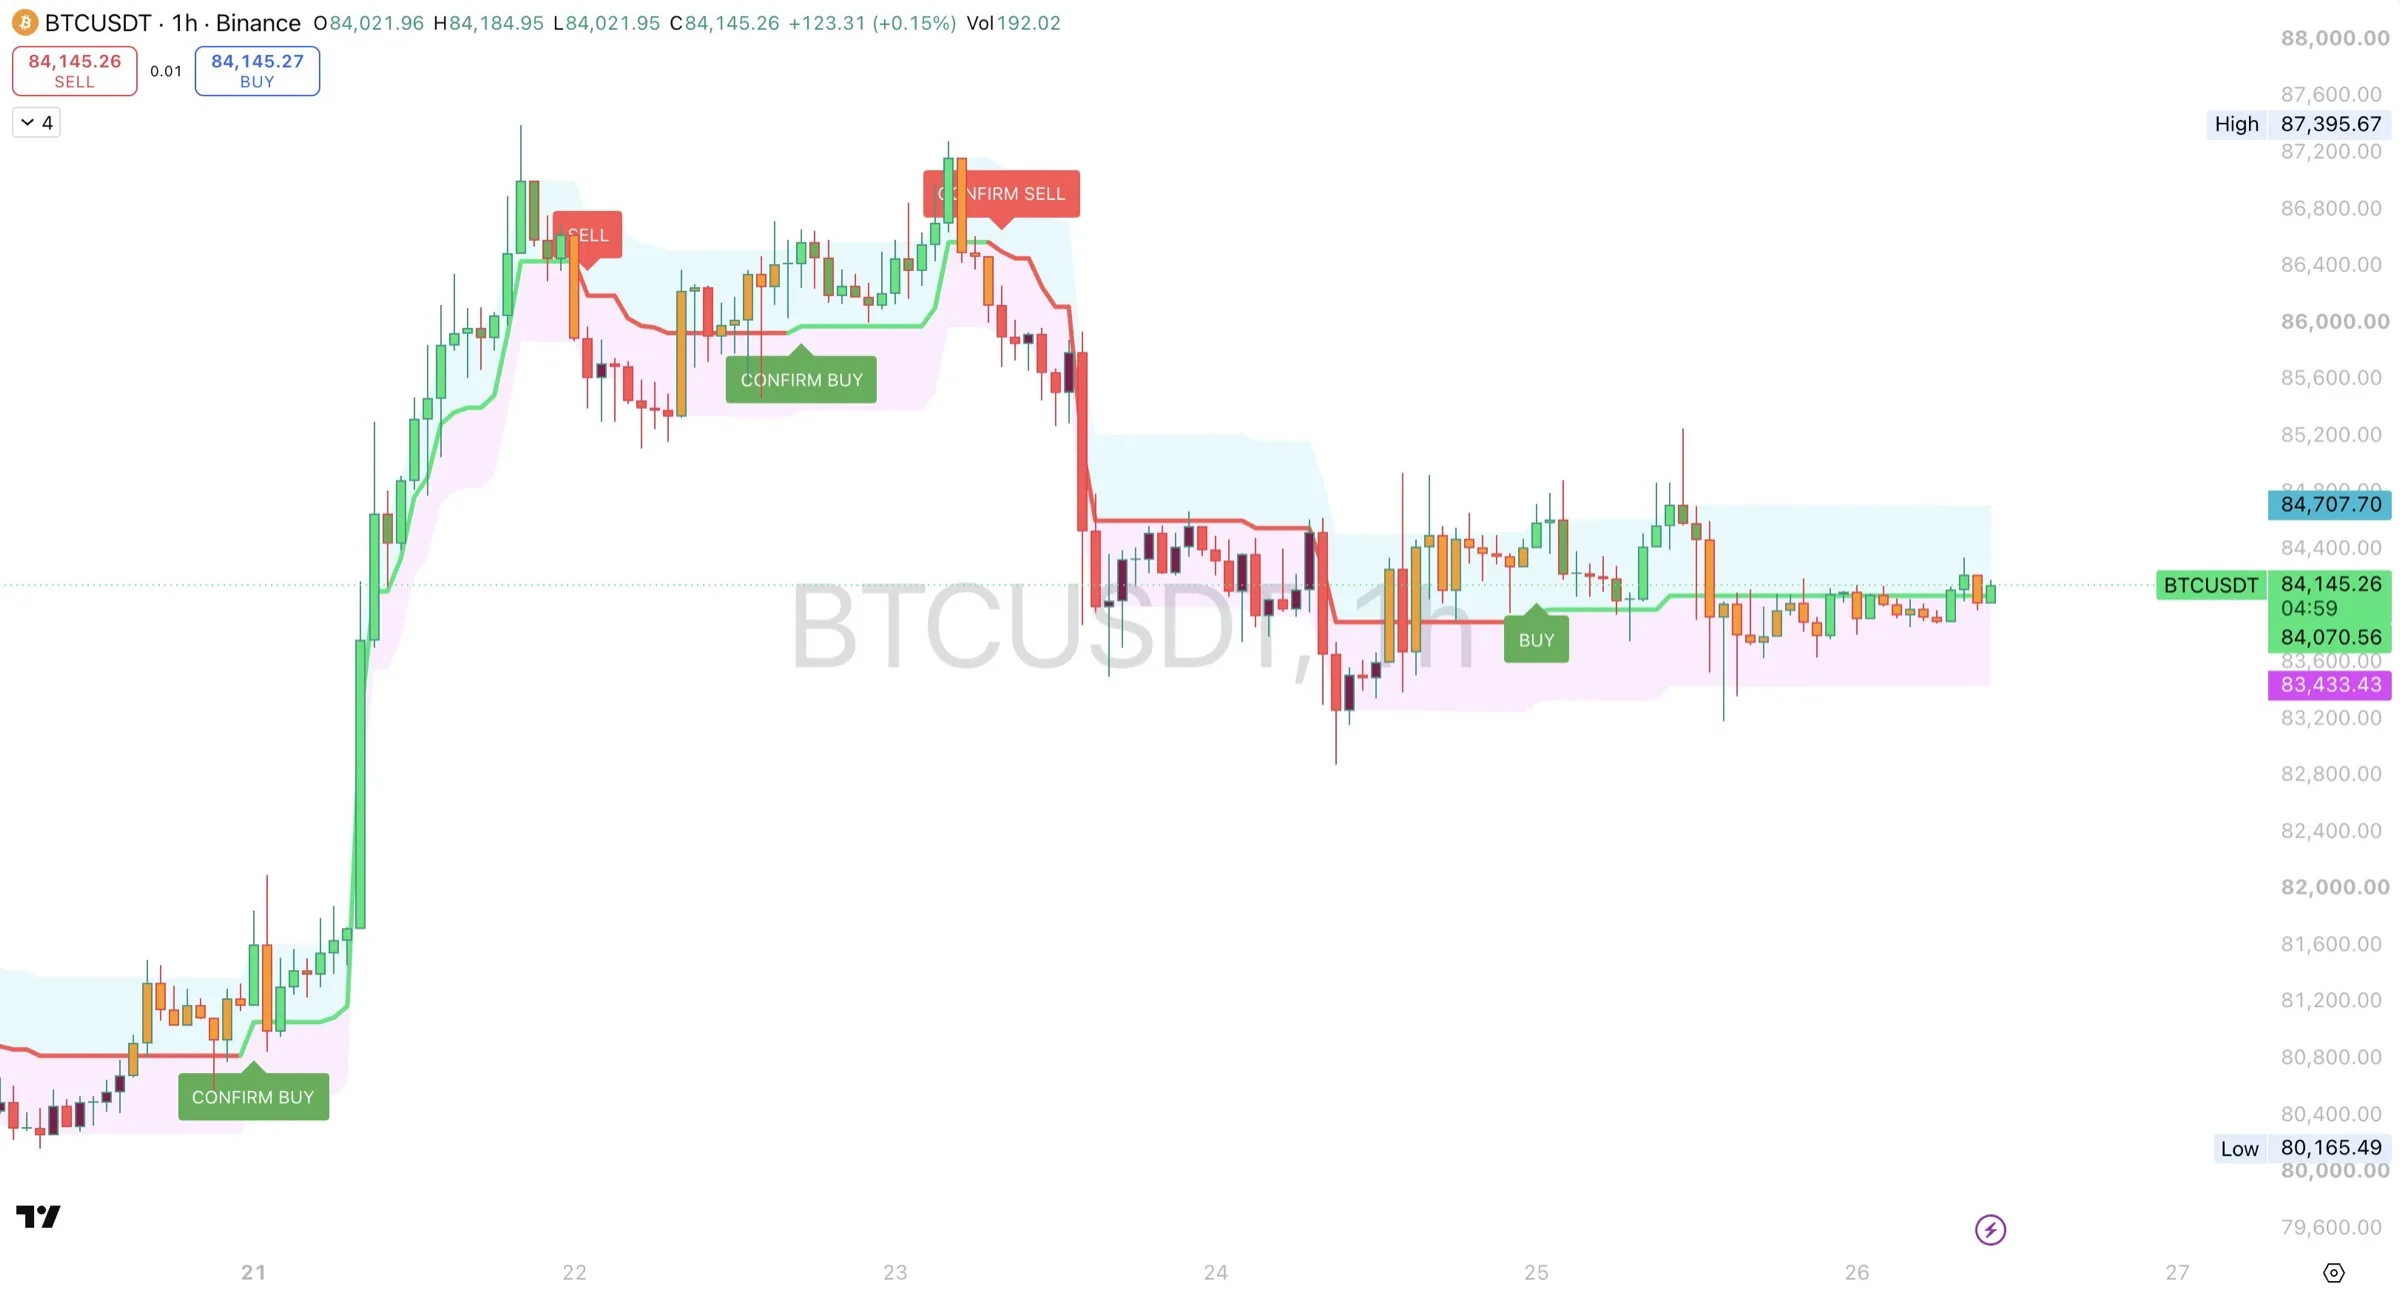
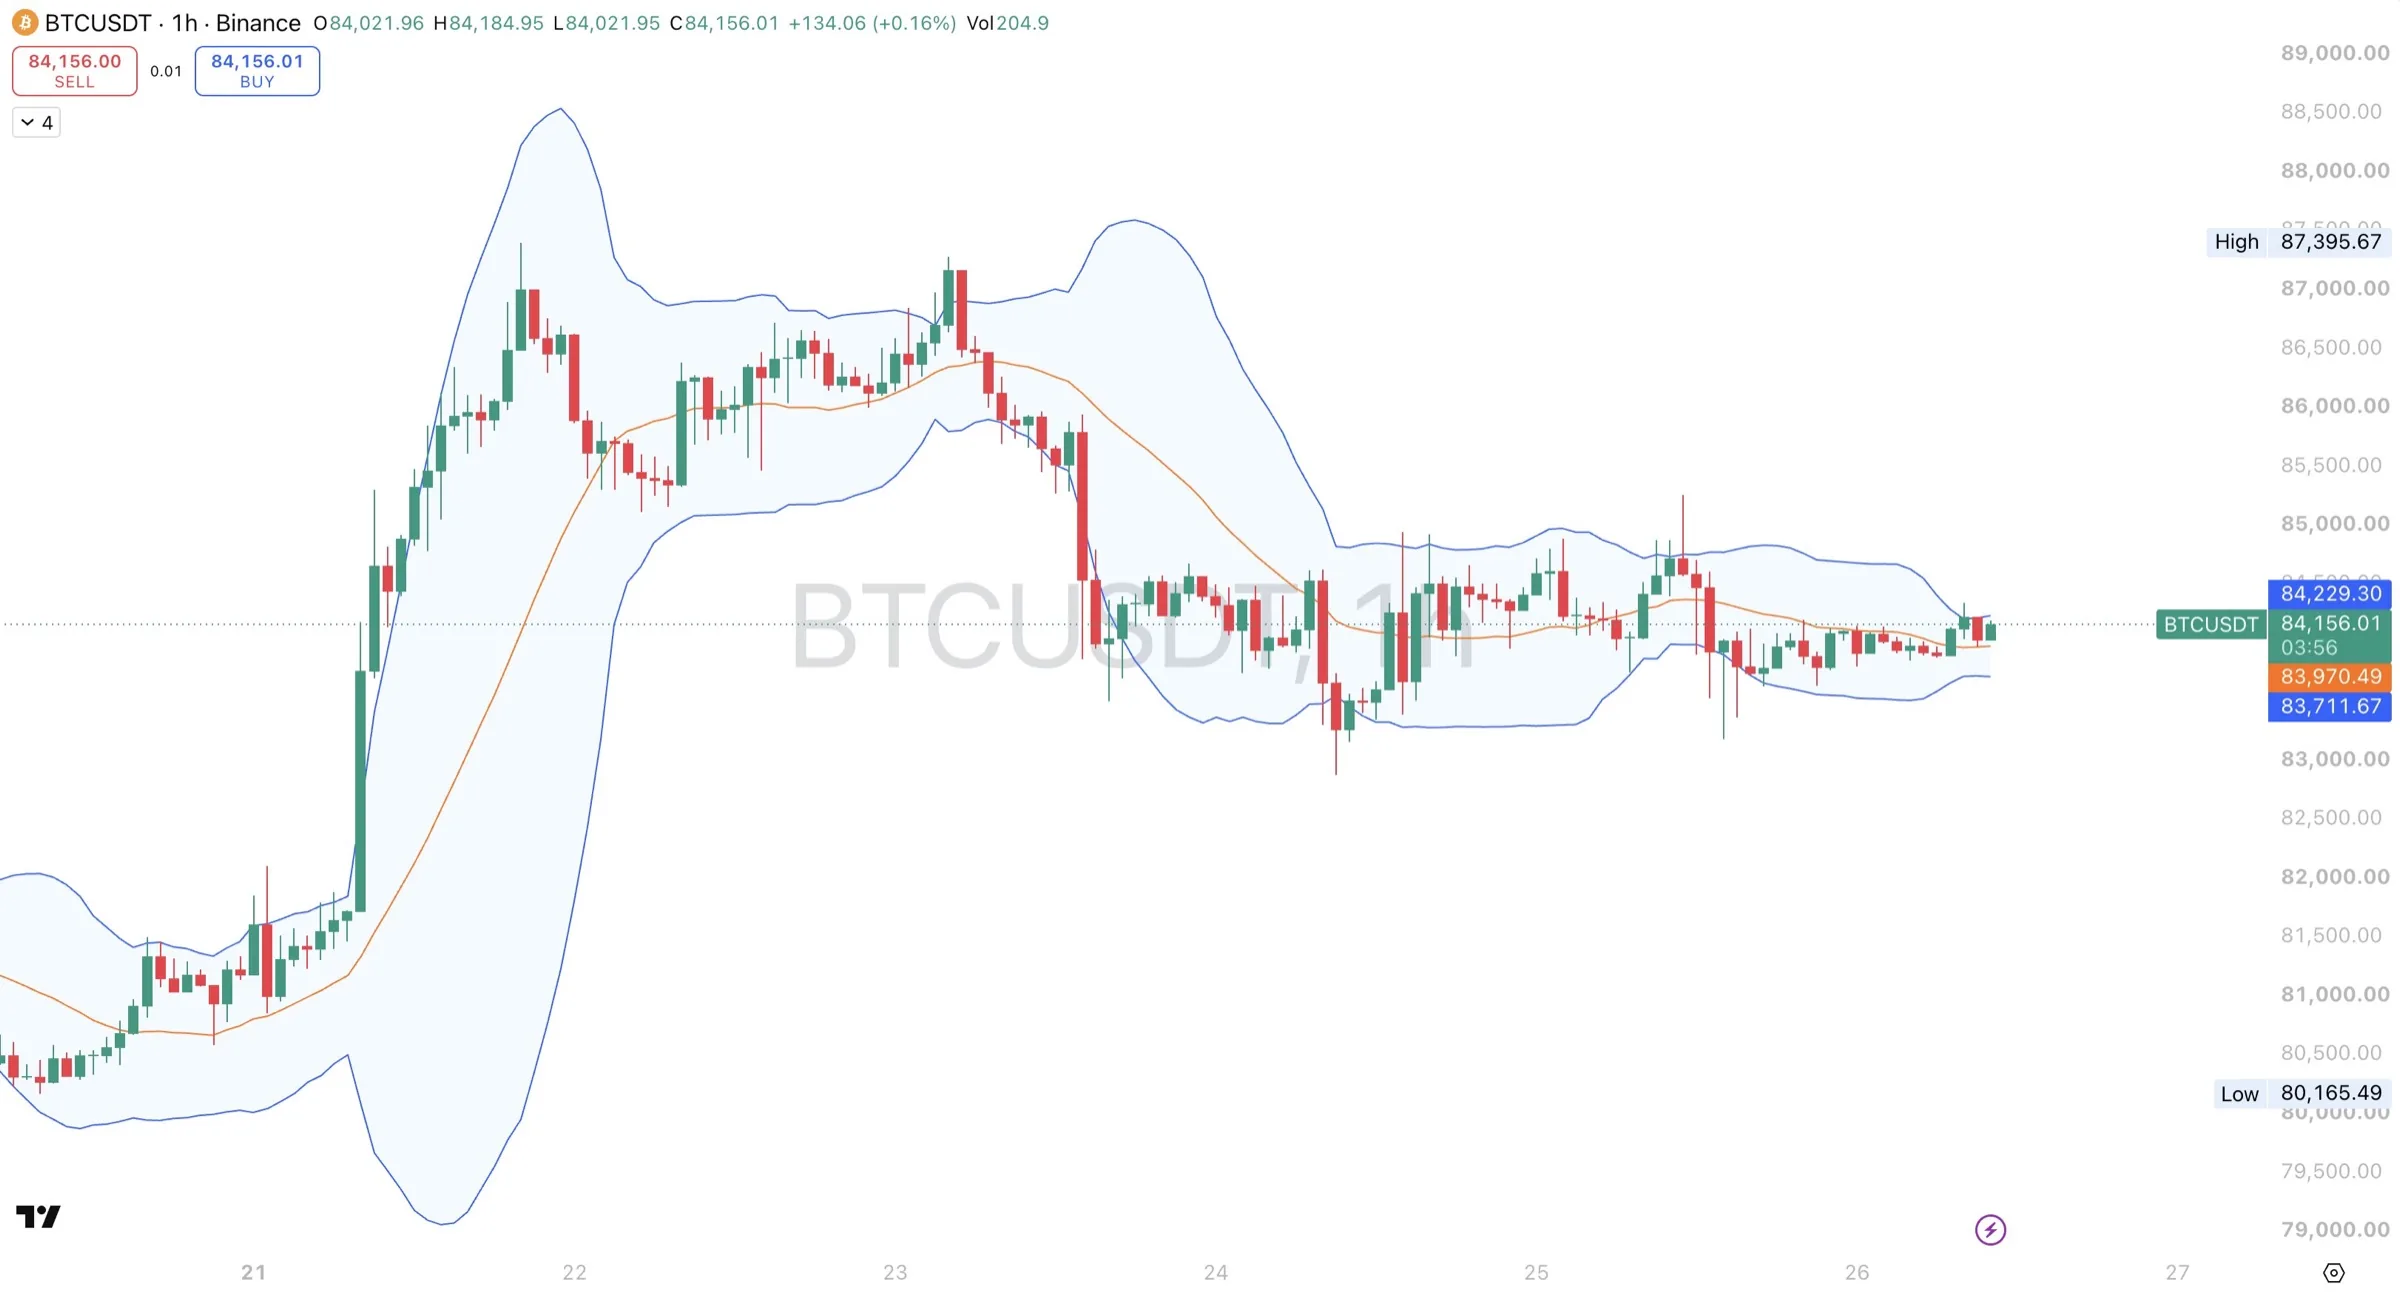
Key takeaways
- Read the three indicators in the same order every time: strength (Trend Core), timing (Trend Confirmation), location (Channel Pro + S/R).
- When all three agree, you have the strongest setup the system offers. When they disagree, waiting is the decision.
- Use 4H for direction, 1H for confirmation and 30m to time the entry.
- A saturated Trend Core reading is a warning, not an entry. Wait for the label on Trend Confirmation.
- Squeezes often come before big moves. Wait for the breakout and the signal instead of picking a side early.
Overview
The Whip system is three TradingView indicators built to be read together. Each one answers a different question. When all three agree, you have the strongest setups the system offers. When they disagree, the system is telling you to wait.
| Module | Question it answers | Where it sits | What you read |
|---|---|---|---|
| Whip Trend Core | How strong is the trend, and is it saturated? | Its own panel below the chart | The Trend line value, its direction, and the buying and selling columns |
| Whip Trend Confirmation | Has the trend flipped, and is the flip confirmed? | On the price chart | BUY / SELL and CONFIRM BUY / CONFIRM SELL labels, the trend line and clouds |
| Whip Channel Pro | Where is price, where are the key levels, and is volatility expanding or contracting? | On the price chart | The channel boundaries, center line, channel width, and the support and resistance levels |
In short: Trend Core is strength, Trend Confirmation is timing, Channel Pro is location.
This guide shows how to combine them. For the details of each indicator (every line, setting and alert), see its own user guide.
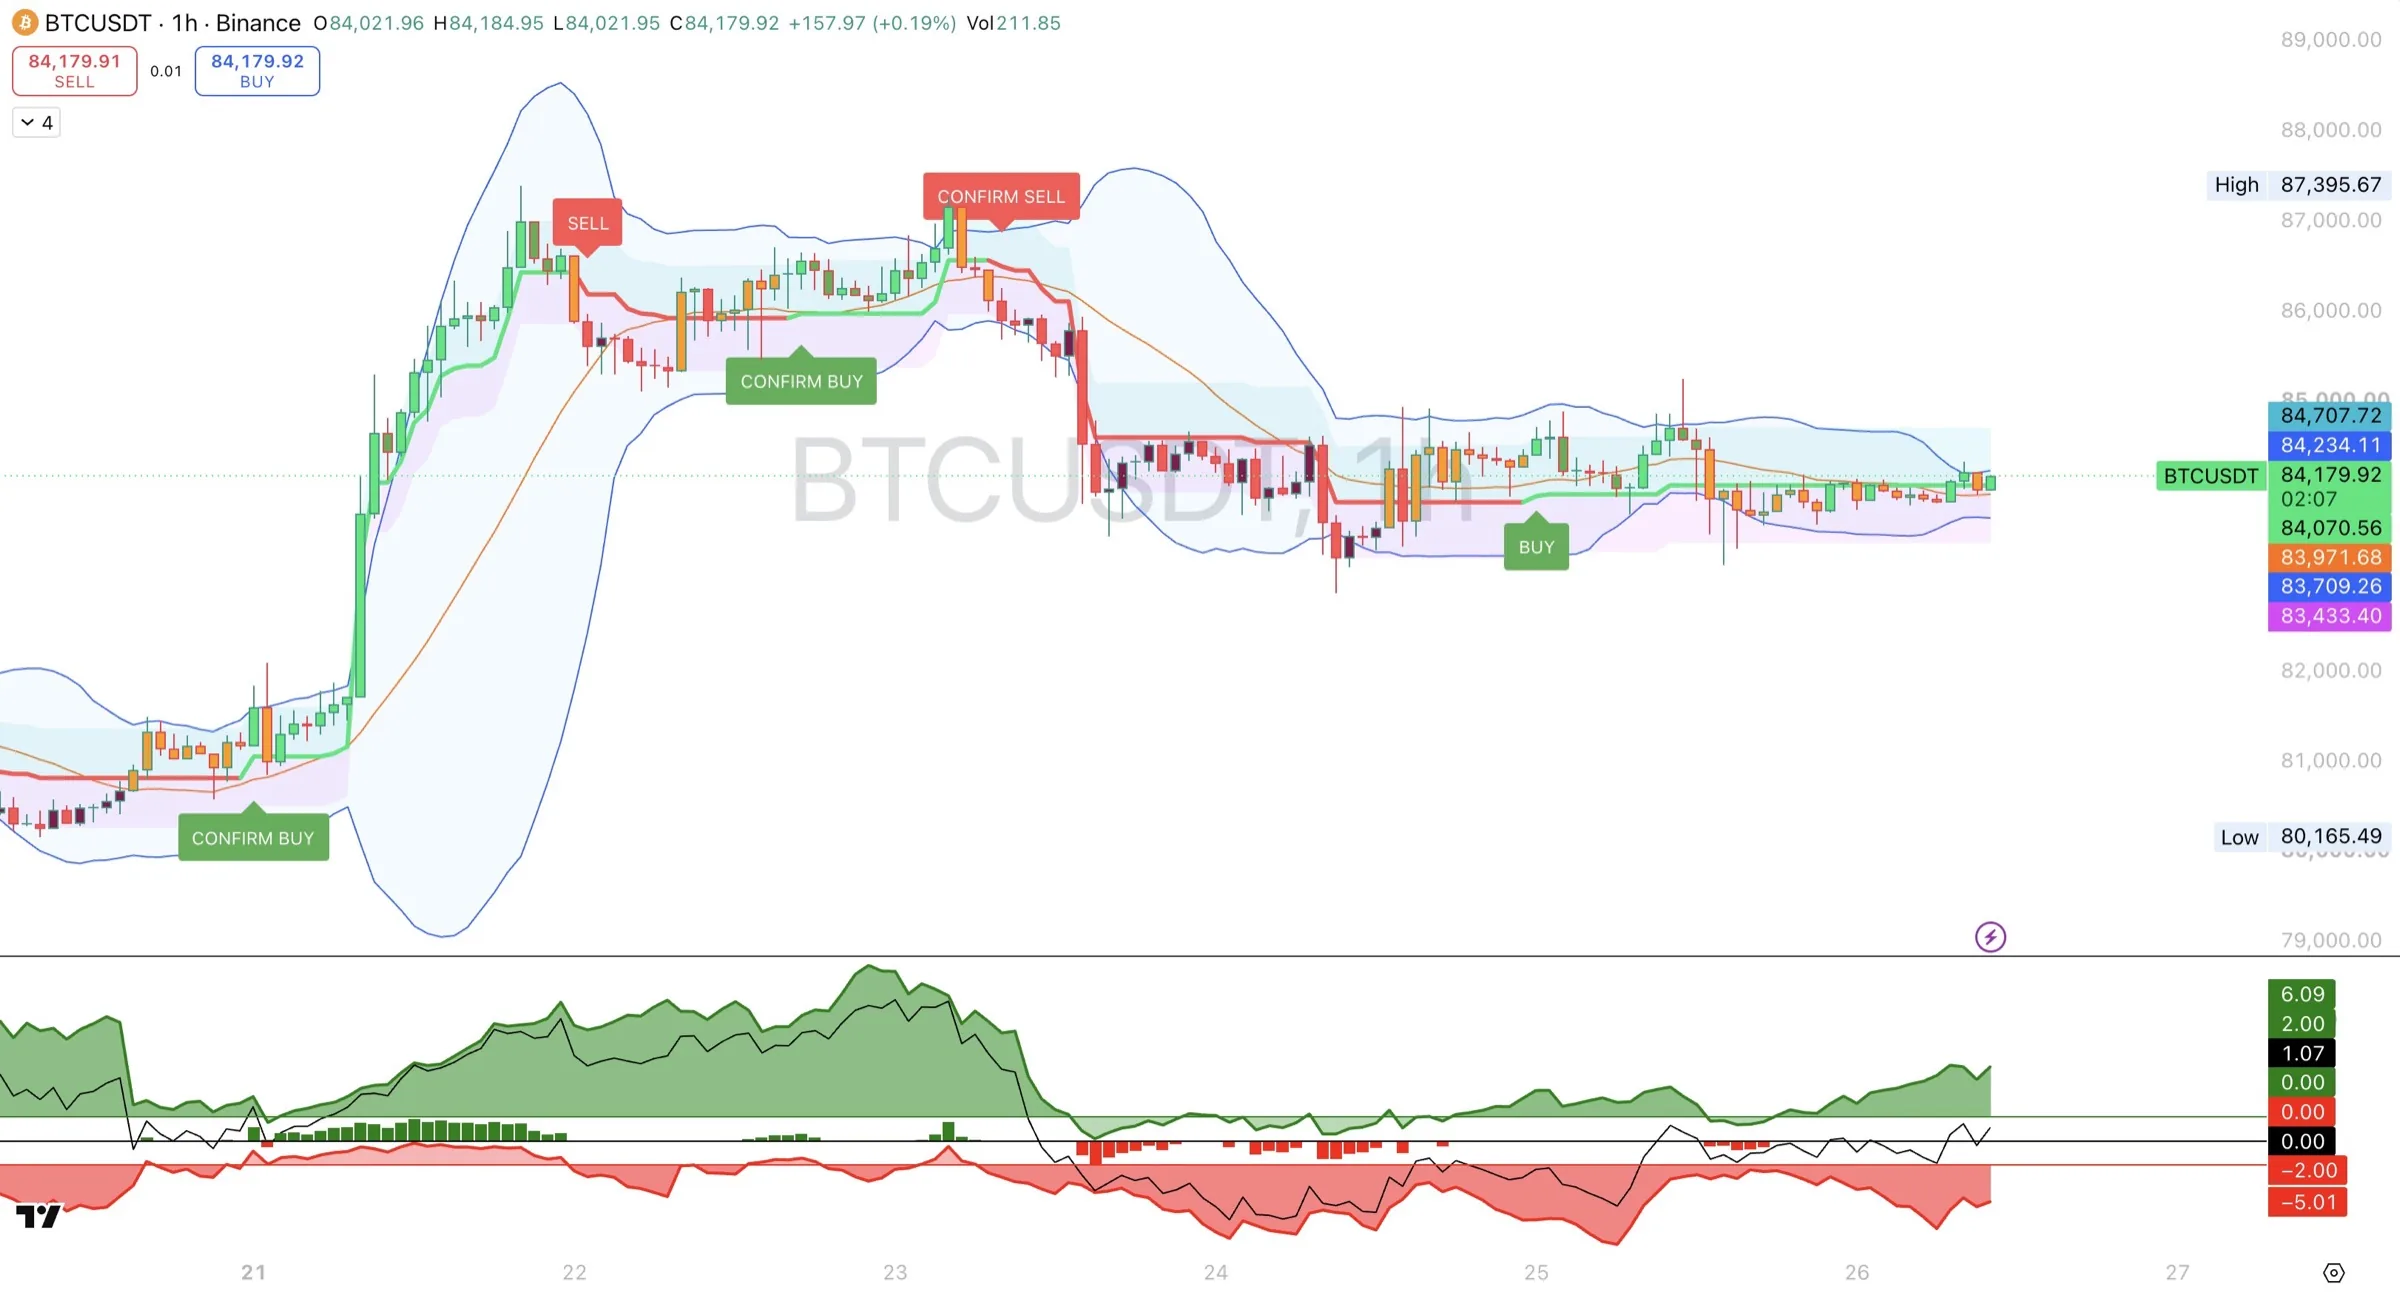
The examples in this guide use this 1-hour chart, plus matching 4-hour and 30-minute charts of the same market. Reading the example chart walks through the 1-hour chart step by step, and Reading 30m, 1H and 4H together shows how the three timeframes fit.
Why traders use the Whip system
It is simple to use. Add the three indicators, keep the default settings, and read them in the same order every time: strength, timing, location. There is nothing to tune and no formula to learn. Once you have worked through the example charts in this guide, you can read a chart with it in a few seconds.
What makes it different:
- Signals are graded, not just printed. Every trend change is labeled as early (BUY / SELL) or confirmed (CONFIRM BUY / CONFIRM SELL), so you know how much weight to give it before you act, instead of treating every signal the same.
- One label per swing. No stream of arrows on every candle. A label means the trend actually changed.
- Strength and saturation, not just direction. Trend Core shows whether a move still has fuel or is stretched, which helps you avoid buying tops and selling bottoms.
- Location built in. Channel Pro shows whether price has room to run before you enter, and flags squeezes that often come before big moves.
- A complete routine across timeframes. 4H for direction, 1H for confirmation, 30m for entry timing. The three modules turn that into a repeatable process.
- Works on any market. Crypto, forex, indices, stocks and commodities, on any timeframe, with the same levels and rules.
- Final on candle close, with alerts. Labels do not change once a candle closes, and alerts can reach your phone, so you do not need to watch charts all day.
- Taught with real examples. This guide walks through the signals that worked and the ones that failed, so you know what to expect before you risk money.
The honest part. No indicator wins every trade. The Whip system is built to help you make clearer decisions and avoid the most common mistakes: chasing stretched moves, trading choppy markets, and ignoring the bigger trend. Your results still depend on your own risk management.
Setting up your chart
- Open a chart of the market you trade on TradingView.
- Go to Indicators, then the Invite-only scripts tab, and add Whip Trend Confirmation, Whip Trend Core and Whip Channel Pro.
- Trend Confirmation and Channel Pro draw on the price chart. Trend Core opens in its own panel underneath.
- Save the layout so all three load together next time.
Keep the chart readable. Two overlays on the same candles can get busy. Common tweaks in each indicator's Style tab:
- Turn off the Channel Pro shading and keep just its lines.
- Turn off Trend Confirmation's candle coloring if you prefer your own candle colors.
- Pick colors that are easy to tell apart. For example, keep Trend Confirmation's line and labels in one color family and Channel Pro's lines in another.
Set up your timeframes. The system is designed to be read on 4H for direction, 1H for confirmation, and 30m for timing entries. The easiest way is a multi-chart layout in TradingView with the same symbol on 4H, 1H and 30m side by side, each with all three indicators. Otherwise, switch between the timeframes on one chart.
How to read the system
Read the three modules in the same order every time. It takes a few seconds once it becomes habit.
1. Strength: Whip Trend Core. Who is in control, and how much?
| Trend Core reading | Meaning |
|---|---|
| Between -2 and +2 | Balanced. No clear control. |
| Above +2 and rising | Buyers in control and gaining. |
| Below -2 and falling | Sellers in control and gaining. |
| Above +8 (default level) | Bullish saturation. The up move is stretched. |
| Below -8 (default level) | Bearish saturation. The down move is stretched. |
Purple columns mean buyers are pushing hard right now. Black columns mean sellers are. Shrinking columns mean that push is fading. The example screenshots in this guide were taken before the color update, so there the columns appear green and red.
New in Trend Core: a table with the readings for 30m, 1H, 4H and 1D, saturation bands and triangle markers, six preset alerts, and saturation presets for crypto, gold, forex and indices. The default saturation level is 8, and some markets suit 10 or higher. For the best setting for your market, see the Whip Trend Core — User Guide.
2. Timing: Whip Trend Confirmation. Has the trend flipped?
| Label | Meaning |
|---|---|
| BUY / SELL | Early signal. The trend has flipped, but the broader trend has not caught up. Better price, more risk. |
| CONFIRM BUY / CONFIRM SELL | Confirmed signal. The flip and the broader trend agree. Later entry, stronger setup. |
Act only on closed candles. A label on a candle that is still forming can disappear.
3. Location: Whip Channel Pro. Is price in a good place to act?
| What you see | Meaning |
|---|---|
| Price near the center line | Room to move either way. Usually a good place to enter. |
| Price pressed against a boundary | Stretched. Entering here in the same direction is late. |
| Price riding a boundary candle after candle | A strong trend. Do not fight it. |
| Channel narrowing (squeeze) | The market is quiet. A bigger move often follows. |
| Channel widening | A new move is under way. |
Putting it together. A trade looks strongest when all three tell the same story: strength behind the move on Trend Core, a CONFIRM label on Trend Confirmation, and room to run on Channel Pro. Each module that disagrees is a reason to wait, trade smaller, or skip.
- 1Strength · Whip Trend Core
The Trend line climbs out of the ±2 balanced zone with buying columns, and it is not yet saturated.
- 2Timing · Whip Trend Confirmation
CONFIRM BUY prints: the flip on this timeframe and the broader trend agree.
- 3Location · Whip Channel Pro + S/R
Price turns up from S1, a support level two timeframes agree on, with room to R1.
- 4Your plan · You decide
Stop beyond S1, first target at R1. Size the trade so the stop costs what you planned.
Reading the example chart
The chart above covers about six days of BTCUSDT on the 1-hour chart: a quiet start near 81,000, a rally to the 87,395 high, a double top, a drop to near 82,900, and a sideways range near 84,000. Here is what each module showed at every stage, reading left to right.
| When | Trend Confirmation | Trend Core | Channel Pro | What it meant |
|---|---|---|---|---|
| 20th | Red line flat near 80,900, price chopping around it | Near 0, almost no columns | Tight channel, under 1,000 wide | Quiet, coiling market. Nothing to do yet. |
| 21st | CONFIRM BUY near 81,000, line turns green | Jumps above +2 with a long run of buying columns | Price breaks out of the top, channel blows open, price rides the upper boundary to 87,395 | All three agree. A strong bullish breakout. |
| 22nd, early | SELL just after the high | Around +10, saturated | Price leaves the upper boundary and pulls back toward the center line | The rally is stretched and pausing. Tighten stops, but this is not a new downtrend. |
| 22nd, late | CONFIRM BUY near 85,900 | Still well above 0 | Center line near 85,500 holds as support | A continuation entry on the pullback. |
| 23rd | CONFIRM SELL near 86,700 at the second peak | About +13, then turning down as the buying columns stop | Rejected at the upper boundary near 87,200 while the channel is flat | Saturation, rejection and a confirmed flip at the same time. A reversal. |
| 23rd to 24th | Red line stepping down | Falls through 0 to around -6, with selling columns | Breaks below the center line and rides the lower boundary to near 82,900 as the channel widens | Sellers in control. Buying the dips here would have been fighting the trend. |
| 25th | BUY near 83,900 | Selling columns fade, line climbs back toward 0 | Price back at the center line, channel narrowing | Selling is exhausted, but there is no confirmed trend change. |
| 25th to 26th | Green line flat near 84,000 | Between about 0 and +1 | Tightest channel on the chart, about 520 wide | A new squeeze. Wait for the breakout and a CONFIRM label. |
Where the chart stands at the right edge. Trend Core reads +1.1, so the market is balanced. Channel Pro is in a tight squeeze with price on the center line. Trend Confirmation's last label is a plain BUY with no CONFIRM behind it. None of the three is giving a clear direction, so the system is saying wait. The next setup comes when price breaks out of the squeeze. A break down would show up as a SELL or CONFIRM SELL, with Trend Core falling below 0 and the channel widening downward. A break up would not print a new label, because Trend Confirmation is already on a BUY. Instead, the green line would start stepping up, Trend Core would climb above +2 with buying columns, and the channel would widen upward.
What this chart teaches:
- The best trades came when all three agreed. The breakout on the 21st and the reversal on the 23rd both had signal, strength and location lined up.
- Saturation came before the top. Trend Core was at +10 and above for a day before the CONFIRM SELL printed.
- Plain labels were warnings. The SELL on the 22nd and the BUY on the 25th both went against the bigger trend, and neither started a lasting move.
- A squeeze is a reason to get ready, not to act. The squeeze on the 20th came before the biggest move on the chart, and the one on the 25th to 26th has not broken yet.
The 30m, 1H and 4H workflow
The system is built around two timeframes. 1H (or 30m) shows you the turn first. 4H confirms it.
| Item | 30m / 1H | 4H |
|---|---|---|
| Role | Early signals | Confirmed signals and the bigger trend |
| Typical label at a turn | BUY / SELL while the market is still deciding, then CONFIRM once the trend agrees | Mostly CONFIRM BUY / CONFIRM SELL |
| Entry price | Closer to the turn, often better | Later, often a higher buy or lower sell |
| Risk | Higher. The turn may not hold. | Lower. The trend has committed. |
| Weight of readings | Short-term | Heavier. A 4H saturation or squeeze matters more. |
The trade-off: 1H gets you in earlier at a better price, but the signal is not confirmed. 4H gives you a confirmed signal, but you usually pay a little more to get in. Plain BUY / SELL can still appear on 4H, so always read the label.
Step by step:
- Start on 4H. Read all three modules. Note the last Trend Confirmation label, the Trend Core reading and direction, and where price sits in the Channel Pro channel. This is your bias.
- Drop to 1H. Wait for a new label on Trend Confirmation in the direction of your 4H bias, or an opposite label after a saturated move. Use 30m if you want a more precise entry, but only in the direction 4H and 1H already agree on.
- Check 1H strength and location. Is Trend Core moving the same way without being saturated? Does Channel Pro show room to run?
- Choose your entry style.
- Early: enter on the 1H signal with a smaller position. Add or hold once 1H prints CONFIRM or 4H flips the same way.
- Confirmed: wait for CONFIRM BUY or CONFIRM SELL on 4H and enter then, accepting a slightly worse price.
- Set your stop and size before entering. The system does not set them for you.
When 1H and 4H disagree, the 4H usually wins. A 1H signal against the 4H trend is most often a pullback or bounce inside the bigger move. Trade small or wait for the 4H to agree.
The same pairing works on other timeframes: 15m with 1H for day trading, or 4H with Daily for swing trading.
Reading 30m, 1H and 4H together
Here is the same market on the 4-hour chart, with all three modules. It covers about a month, so the six days on the 1-hour chart are the last part of it, from the big rally on the right-hand side onward.
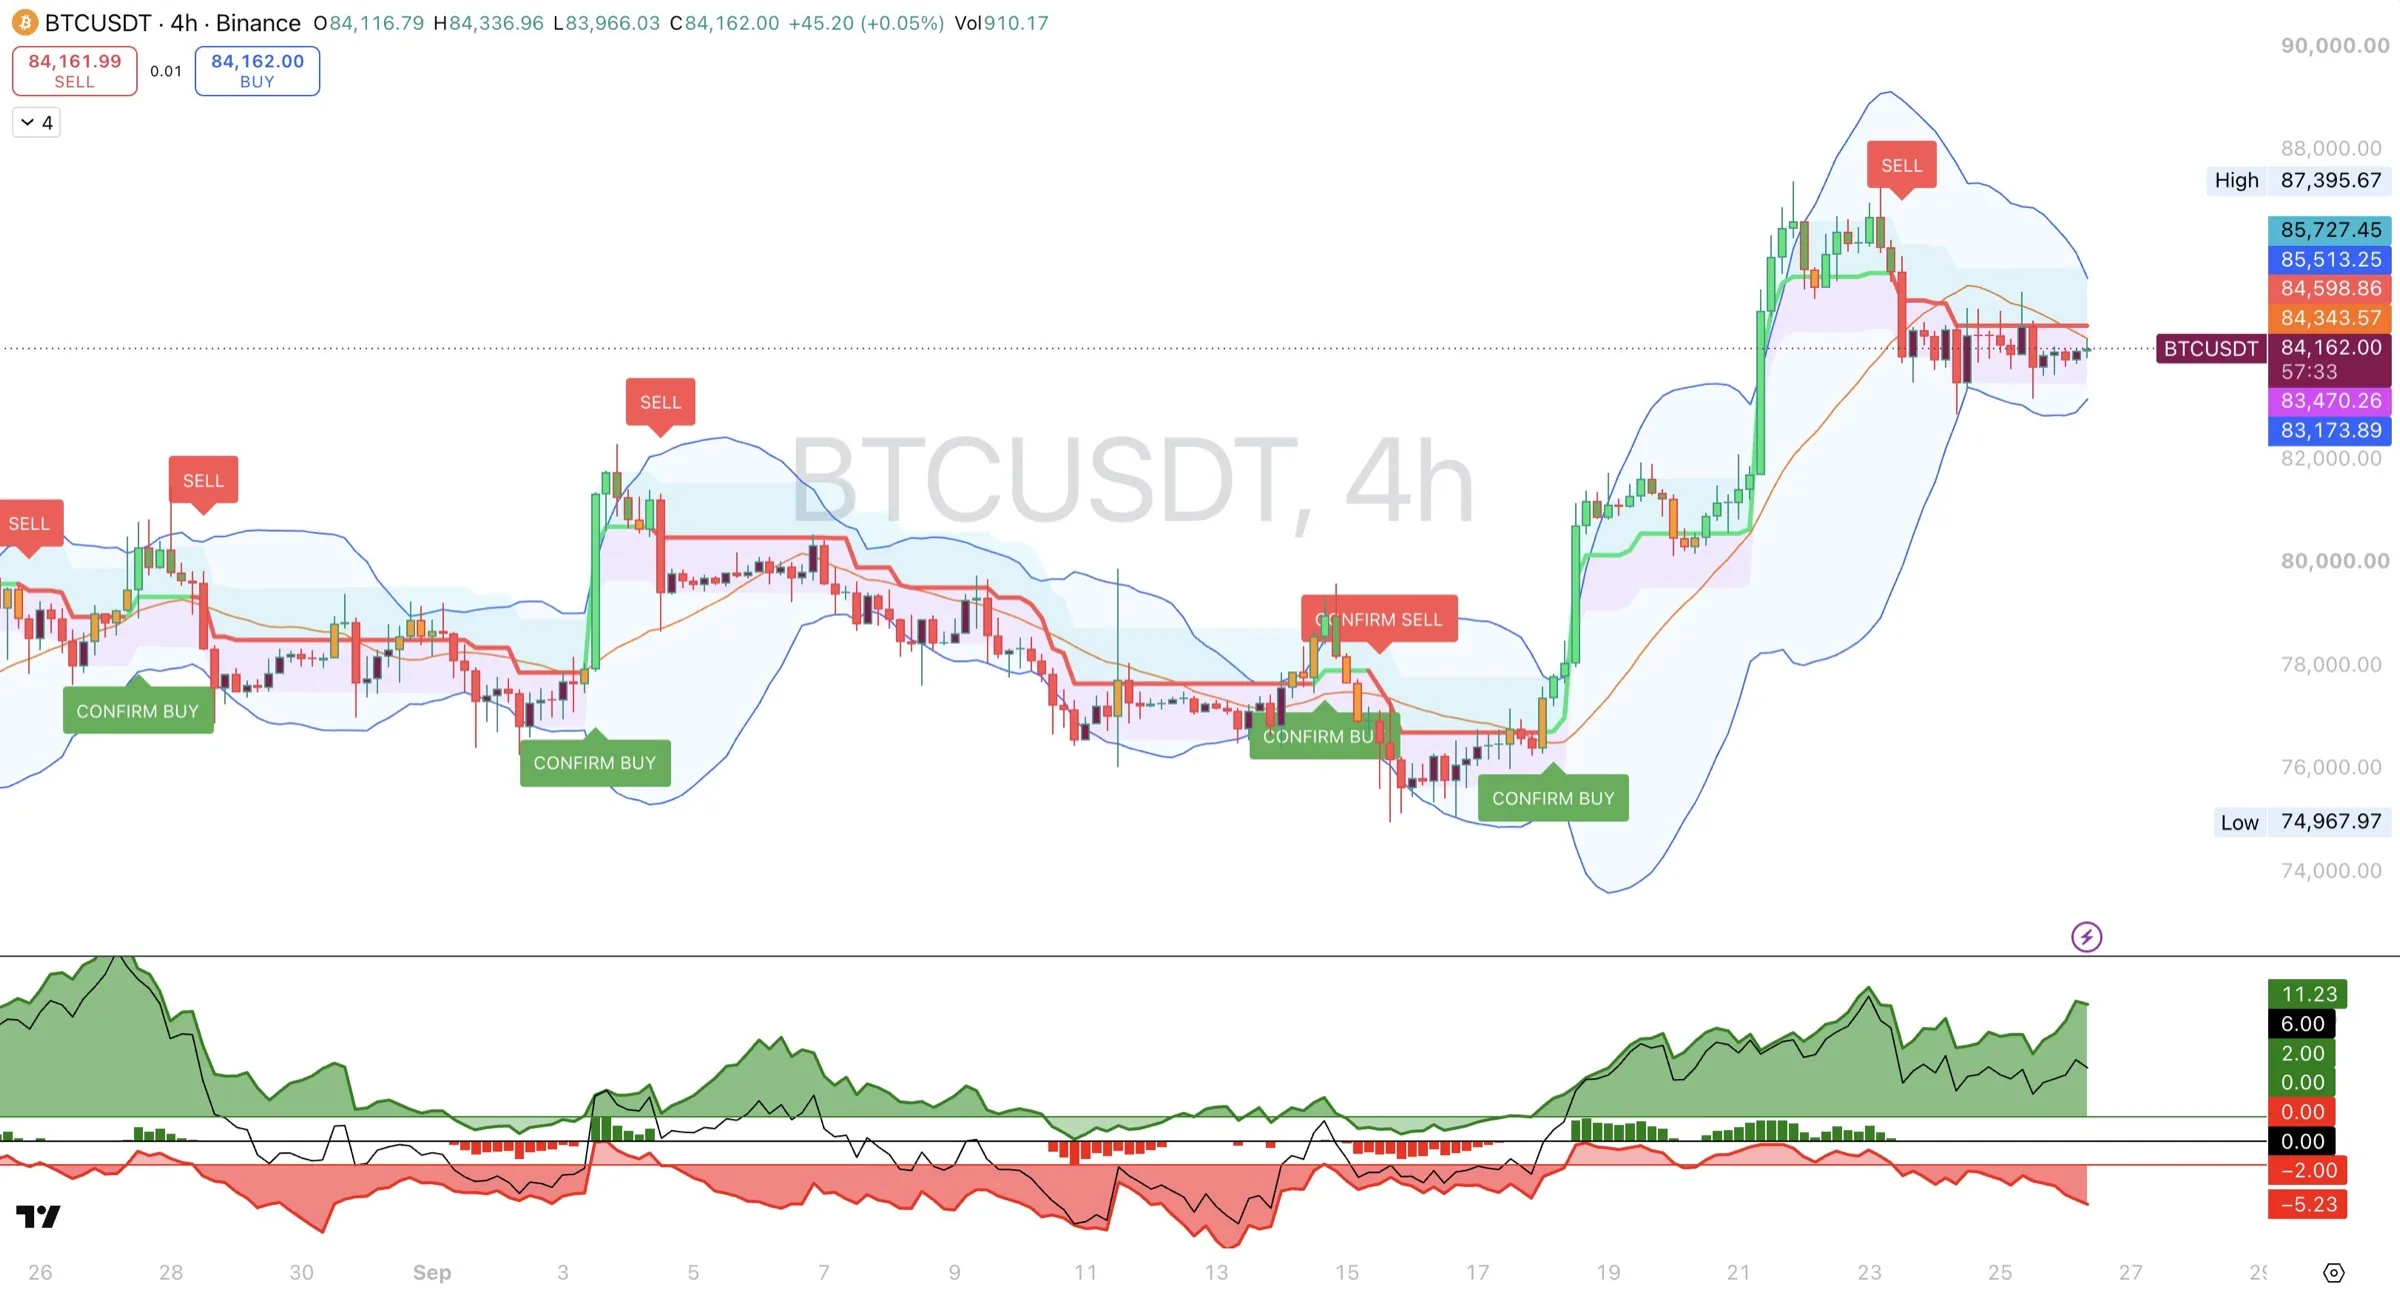
What the 4H chart shows.
| When | Trend Confirmation | Trend Core | Channel Pro | What it meant |
|---|---|---|---|---|
| Early Sep | CONFIRM BUY near 77,000 on the 3rd, then a plain SELL on the 4th, and the line turned red | Brief push above 0, then down to around -7 to -8 by the 11th to 13th, with selling columns | Price drifted from the center line to the lower boundary | A weak bounce that failed, then a slow downtrend with sellers in control. |
| 14th to 15th | CONFIRM BUY, then a CONFIRM SELL a day later | Hovering around 0 | Flat channel, price in the middle | Two opposite signals in a row in a flat market. A classic time to stay out. |
| 15th to 16th | Red line | Back below 0, selling columns | Price rode the lower boundary to the 74,968 low | Last leg of the sell-off. |
| 18th | CONFIRM BUY near 76,500 | Selling columns fade, line climbs through 0, then buying columns | Price breaks through the upper boundary and the channel blows open | All three agree. The start of the rally. |
| 19th to 22nd | Green line stepping up | Above +2 and rising to about +12 by the 22nd | Price rides the upper boundary to 87,395 | A strong uptrend, reaching saturation near the top. |
| 23rd | Plain SELL near 87,000 | Drops from about +12 but stays well above 0 | Price falls back from the upper boundary toward the center line | Buyers ease off, but the 4H uptrend is not broken. |
How the two timeframes fit.
- 4H showed the turn first at the bottom. The 4H CONFIRM BUY came on the 18th, near 76,500. By the time the 1H chart printed its CONFIRM BUY near 81,000 on the 21st, the 4H uptrend was already three days old. The 1H signal was a continuation entry inside a trend the 4H had already confirmed.
- At the top, the two timeframes disagreed. The drop on the 23rd printed a CONFIRM SELL on 1H but only a plain SELL on 4H. On 1H, the trend had clearly turned. On 4H, the bigger uptrend from 76,000 was still intact and the drop was a pullback. This is exactly why the guides say to check both: the same move meant different things on each timeframe.
- The 4H Trend Core reading gave the context. On 1H, Trend Core fell to around -6 during the drop. On 4H, it only fell from about +12 to around +6 and never went below 0. Sellers won the short-term fight, but buyers still controlled the bigger picture.
What the 30m chart shows. Here is the same market on the 30-minute chart, covering the 22nd to the 26th.
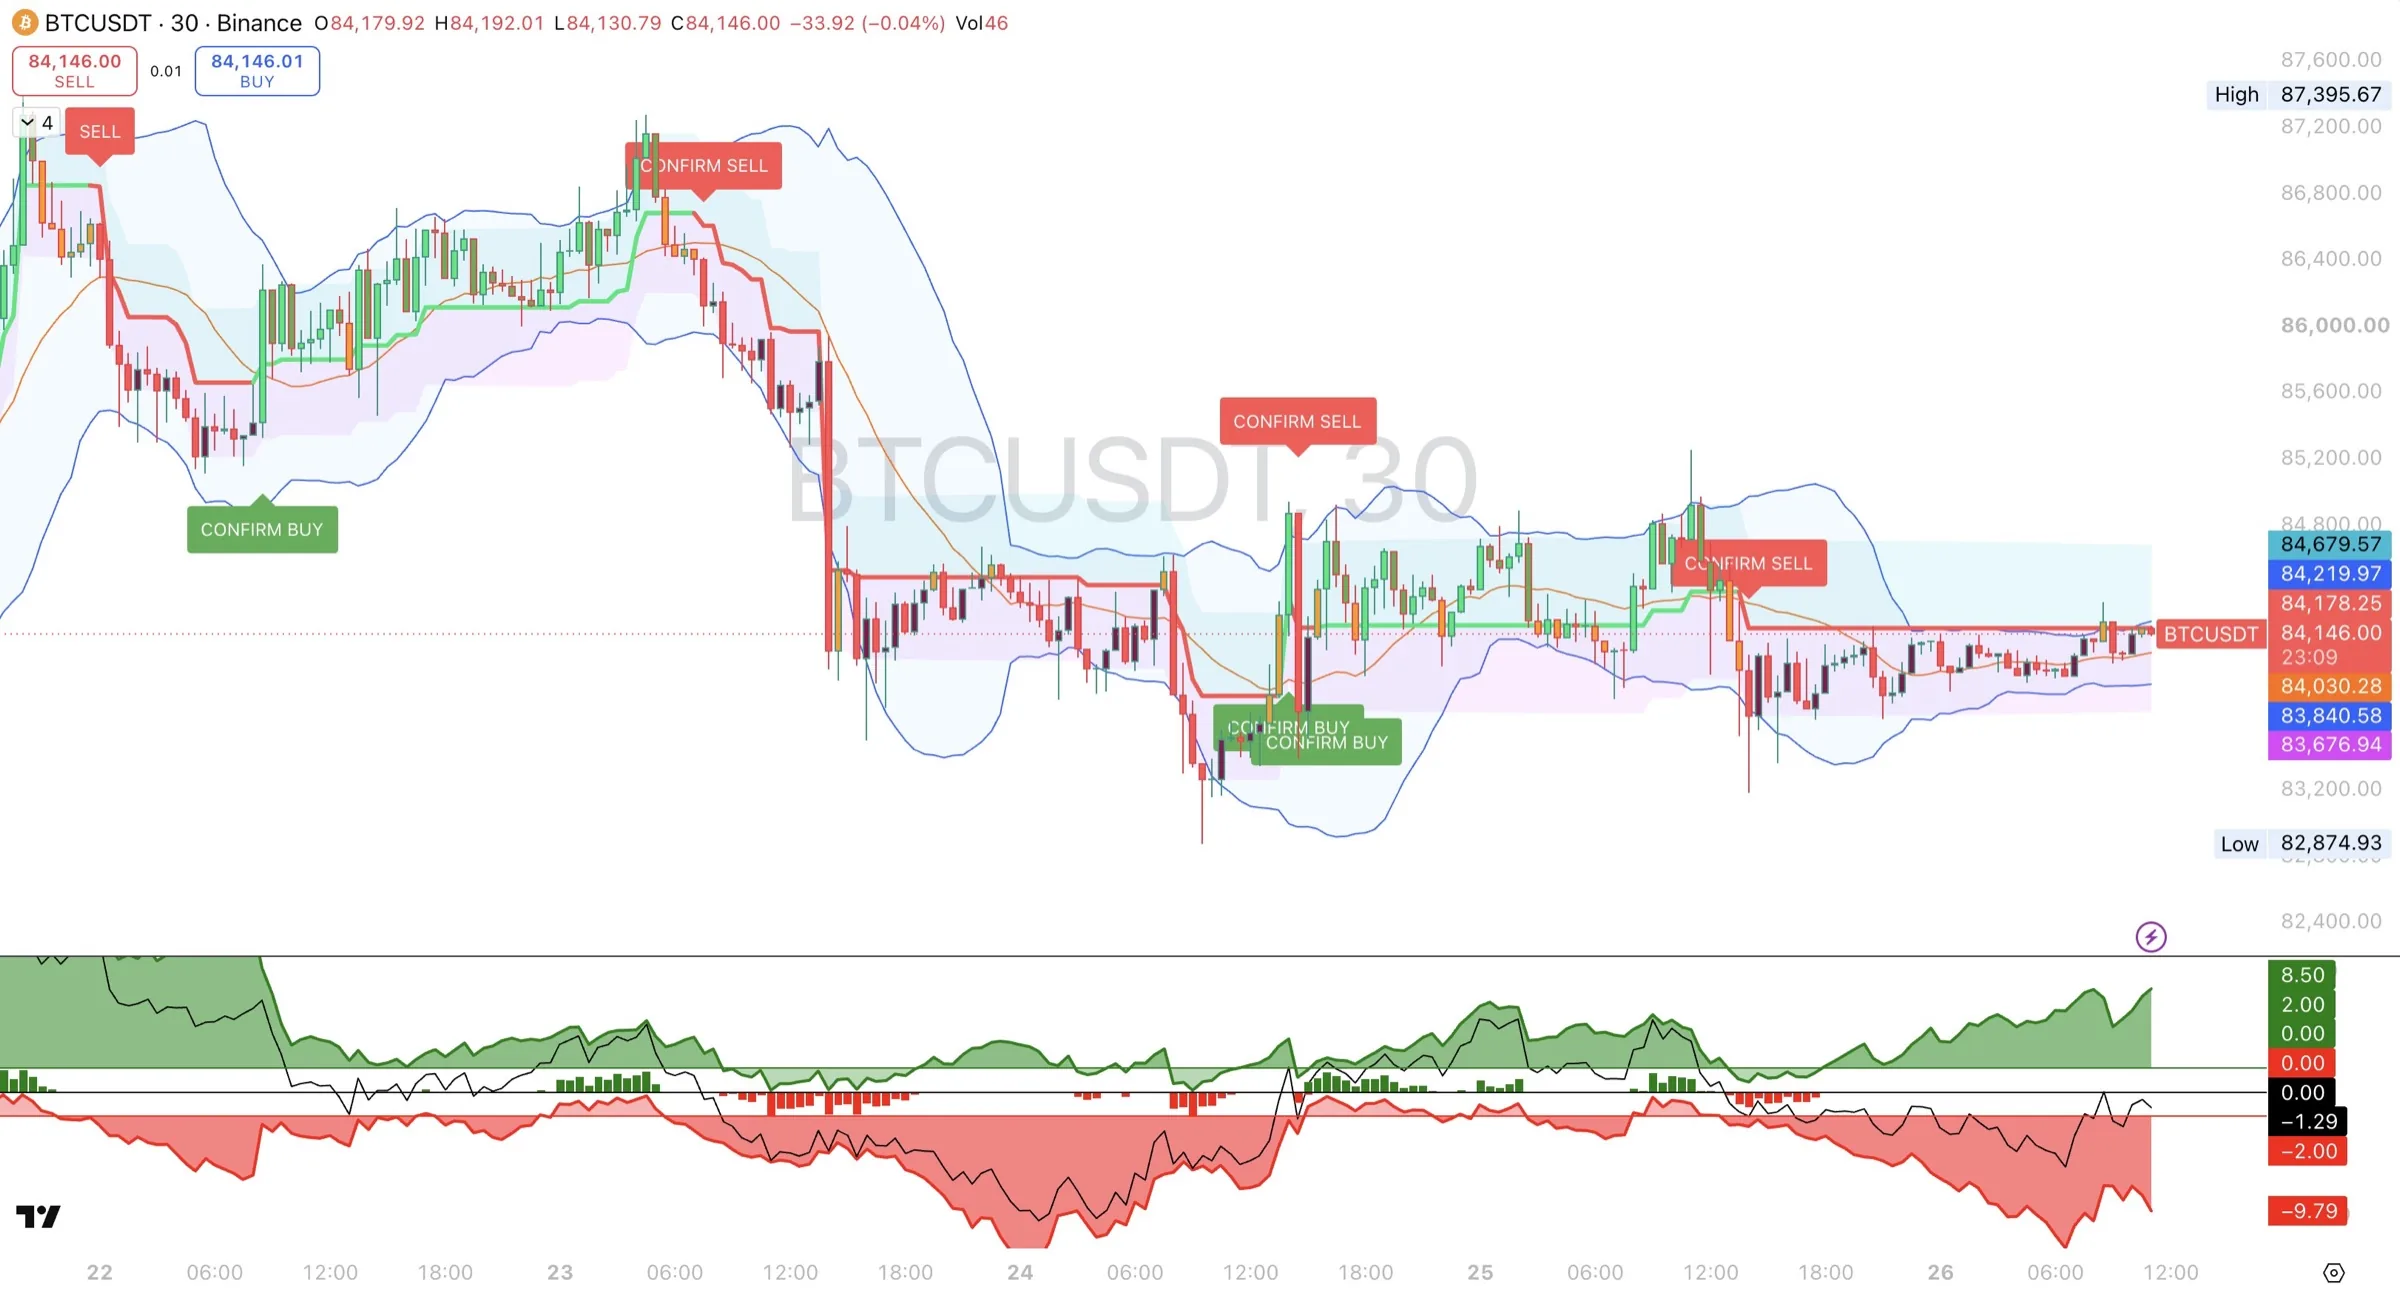
| When | Trend Confirmation | Trend Core | Channel Pro | What it meant |
|---|---|---|---|---|
| 22nd, early | SELL near 87,000 | Around +11, saturated, then falling | Price drops from the upper boundary to the lower boundary | The stretched rally cools off. A pullback. |
| 22nd, morning | CONFIRM BUY near 85,300 | Climbs back above 0 | Price turns up from the lower boundary | The uptrend resumes. |
| 23rd, morning | CONFIRM SELL near 86,800 | Turns down, then selling columns | Price falls through the center line, and a large red candle blows the channel open in the afternoon | The top is confirmed and the drop starts. |
| 24th, early | Red line stepping down | Down to around -10 | Price rides the lower boundary to the 82,875 low | Saturated selling. |
| 24th, afternoon | CONFIRM BUY, CONFIRM SELL, then CONFIRM BUY again, all within about two hours | Swinging around 0 | Huge candles hit both boundaries | A whipsaw. The market is too volatile to read. Stay out. |
| 25th, afternoon | CONFIRM SELL near 84,500 after a rejection near 85,300 | Falls from around +6 back below 0 | Price rejected at the upper boundary | A short drop back into the range. |
| 26th | Red line flat near 84,200, price just below it | About -1.3 | Squeeze, about 380 wide | Balanced and quiet. |
What 30m adds:
- It sees turns earliest. The 30m CONFIRM BUY near 83,700 on the afternoon of the 24th came almost a day before the 1H BUY near 83,900 on the 25th.
- It pays for speed with noise. 30m printed seven labels in about four days, including three in two hours on the 24th. 1H printed five in six days. 4H printed 12 in about five weeks.
- It saturates faster. 30m Trend Core reached about -10 during the drop, while 1H only reached about -6 and 4H stayed above 0. Use a 30m saturation reading as an early warning, and check 1H and 4H before acting on it.
- Use 30m to time entries, not to decide direction. Decide direction on 4H, confirm on 1H, and use 30m for a more precise entry in that direction.
Where all three charts stand at the right edge.
| Item | 30m | 1H | 4H |
|---|---|---|---|
| Trend Confirmation | Last label CONFIRM SELL (25th). Red line flat near 84,200, price just below it. | Last label plain BUY (25th). Green line flat near 84,000. | Last label plain SELL (23rd). Red line near 84,600, price just below it. |
| Trend Core | About -1.3. Balanced. | About +1. Balanced. | About +6. Buyers still in control, but well off the +12 peak. |
| Channel Pro | Squeeze, about 380 wide, price on the center line | Squeeze, about 520 wide, price on the center line | Narrowing, about 2,300 wide, price between the center line and the lower boundary |
Put together: the 4H uptrend has lost momentum but has not broken. 30m and 1H are both balanced and squeezing, and their last labels point in opposite directions. No timeframe has a confirmed signal that the others agree with, so the system says wait. What to watch for:
- If the uptrend resumes: 30m and 1H channels break upward, Trend Core on both climbs above +2 with buying columns, 30m flips to BUY or CONFIRM BUY, and 4H flips back to BUY or CONFIRM BUY. All three timeframes would line up.
- If the pullback turns into a real downtrend: 1H prints a SELL or CONFIRM SELL out of the squeeze, 30m keeps its red line stepping down, and 4H Trend Core falls toward 0 and below. A 4H CONFIRM SELL would confirm the bigger trend has changed.
Until one of these happens, any 30m or 1H signal is trading against, or without the support of, the 4H picture.
Analyze your own charts: 30m, 1H and 4H
This is the routine to run on any market, any time you want to know what the Whip system is saying. It takes a few minutes once you are used to it.
Before you start
- Open the same symbol on 4H, 1H and 30m, each with all three indicators.
- Use closed candles only. Ignore the candle that is still forming.
- Scroll so each chart shows at least a few days of history, so you can see the last label and the recent swings.
Step 1: Fill in the worksheet. For each timeframe, write down one line per module:
| Item | 30m | 1H | 4H |
|---|---|---|---|
| Trend Confirmation: last label, and line color | |||
| Trend Core: reading, direction, columns | |||
| Channel Pro: where price sits, and is the channel widening, flat or squeezing? |
Step 2: Read each timeframe on its own. For each column, ask:
- Direction: is the last label a BUY / CONFIRM BUY or a SELL / CONFIRM SELL, and is the line green or red?
- Strength: is Trend Core above +2, below -2, or balanced between them? Is it saturated (beyond ±8 by default)?
- Location: is price near the center line with room to move, pressed against a boundary, or inside a squeeze?
Step 3: Compare the timeframes.
| What you see | What it usually means |
|---|---|
| All three point the same way, and Trend Core is strong but not saturated | The strongest setup the system offers. |
| 4H and 1H agree, 30m disagrees | A short-term pullback inside the bigger move. Use 30m to time the entry once it turns back. |
| 4H disagrees with 1H and 30m | The shorter timeframes are moving against the bigger trend. Treat it as a pullback until 4H changes too. |
| Trend Core saturated on 1H or 4H | The move is stretched. Protect profits, do not chase, and watch for the opposite label. |
| Squeezes on two or more timeframes | The market is coiling. Wait for the breakout and a label in the same direction. |
| Labels flipping back and forth on 30m or 1H | A choppy market. Stay out. |
Step 4: Write one sentence. Summarize what the system is saying, then write what you are waiting for. For example: "4H uptrend is intact but fading, 1H and 30m are squeezing, so I wait for 1H to break up with Trend Core above +2."
Step 5: Only then consider a trade. If the timeframes agree, run the buy or sell checklist below. Decide your stop and position size before you enter. If they do not agree, waiting is a valid decision.
A filled-in example. Here is the worksheet for the example charts in this guide, at the right edge:
| Item | 30m | 1H | 4H |
|---|---|---|---|
| Trend Confirmation | CONFIRM SELL, red line flat | BUY, green line flat | SELL, red line, price just below it |
| Trend Core | About -1.3, balanced | About +1, balanced | About +6, buyers in control but fading |
| Channel Pro | Squeeze, price on the center line | Squeeze, price on the center line | Narrowing, price between center and lower boundary |
One sentence: The 4H uptrend has lost momentum but has not broken, and 30m and 1H are balanced and squeezing with labels pointing opposite ways, so the system says wait for a breakout that the timeframes agree on.
What this routine does not do. It tells you what the indicators are showing. It does not pick entries, stops or position sizes for you, and it does not predict what price will do next. Those decisions, and the risk, stay with you.
Buy and sell checklists
Run through these before every trade. The more boxes you tick, the stronger the setup. Missing boxes are a reason to size down or wait.
Buy checklist
Sell checklist
Quick signal matrix
| Trend Confirmation | Trend Core | Channel Pro | Verdict |
|---|---|---|---|
| CONFIRM BUY | Rising through 0 or above +2 | Near center, room to run | Strongest buy |
| CONFIRM BUY | Above +8 | Pressed against upper boundary | Late. Wait for a pullback. |
| BUY | Below -8, then easing back | At or below lower boundary | Early reversal. Small size. |
| BUY | Still falling below -2 | Riding lower boundary | Likely just a bounce. Avoid. |
| CONFIRM SELL | Falling through 0 or below -2 | Near center, room to fall | Strongest sell |
| CONFIRM SELL | Below -8 | Pressed against lower boundary | Late. Wait for a bounce. |
| SELL | Above +8, then easing back | At or above upper boundary | Early reversal. Small size. |
| SELL | Still rising above +2 | Riding upper boundary | Likely just a pullback. Avoid. |
Three core setups
Most trades with the Whip system fall into one of these three patterns.
1. Trend continuation
The trend is already running and you want to join it or stay in it.
- Trend Confirmation: the last label on 4H is CONFIRM BUY (or CONFIRM SELL), and no opposite label has printed since.
- Trend Core: Trend line above +2 (or below -2), with buying (or selling) columns, but not yet saturated.
- Channel Pro: price riding the boundary in the trend's direction, or pulling back to the center line.
How to use it: the best entries come on pullbacks to the Channel Pro center line while Trend Core stays on the right side of 0. If you are already in the trade, hold while price keeps riding the boundary and Trend Core stays strong.
Example: on the 21st, Trend Confirmation printed a CONFIRM BUY near 81,000, Trend Core climbed with a run of buying columns, and price rode the upper Channel Pro boundary to the 87,395 high. On the 22nd, a plain SELL marked a pullback to the Channel Pro center line near 85,500, which held. Trend Confirmation then printed a CONFIRM BUY and price climbed back above 87,000. That pullback to the center line, with Trend Core still well above 0, was the continuation entry.
2. Reversal after saturation
A trend has run hard and is running out of fuel.
- Trend Core: Trend line saturated, below -8 after a big drop (or above +8 after a big rally). The saturation band ends, a triangle marker appears, and the line turns.
- Channel Pro: price at or beyond the outer boundary, with a very wide channel.
- Trend Confirmation: the first opposite label prints. On 1H this is usually a plain BUY or SELL. On 4H, wait for CONFIRM.
How to use it: a saturated reading is a warning, not an entry. Stop adding to the old trend and protect profits. Enter the new direction only when Trend Confirmation prints the label: 1H for an early, smaller position, 4H for a confirmed one. In our testing, stretched moves in trending markets such as Bitcoin often kept going, so never take this setup without the label.
Example: by the 23rd, Trend Core had reached about +13, deep in saturation, and price pushed back to the upper Channel Pro boundary near 87,200 while the channel was flat. Price was rejected there, Trend Core's buying columns stopped and the line turned down, and Trend Confirmation printed a CONFIRM SELL. Price then broke below the Channel Pro center line and rode the lower boundary down to near 82,900 on the 24th, while Trend Core fell below 0 with selling columns. The same pattern played out in miniature on the way back: when Trend Core's selling columns faded and the line climbed toward 0 on the 25th, Trend Confirmation printed a BUY and the sell-off stopped.
3. Squeeze breakout
The market has gone quiet and is building up to a move.
- Channel Pro: the channel narrows to one of its tightest widths in a while.
- Trend Core: Trend line near 0, with few or no columns.
- Trend Confirmation: a new label prints as price breaks out and the channel starts to widen.
How to use it: do not guess the direction during the squeeze. Wait for the channel to start widening, a close outside a boundary, and a Trend Confirmation label in the same direction. Trend Core moving away from 0 in that direction adds confirmation. Squeezes can fake out, so the label matters more than the first poke outside the channel.
Example: on the 20th, the Channel Pro channel tightened to under 1,000 wide near 81,000, Trend Core sat near 0, and Trend Confirmation's line was flat. Early on the 21st, price broke out of the top of the channel, the channel blew open, Trend Core jumped with buying columns, and Trend Confirmation printed a CONFIRM BUY. The move ran to 87,395. By the 25th to 26th, the same conditions were back: a channel only about 520 wide around 84,000 and Trend Core near 0. That is the next squeeze in progress. The setup is to wait for the breakout and the signal, not to pick a side in advance.
When to stay out
Knowing when not to trade is half the value of the system. Stand aside, or trade much smaller, when you see any of these:
- The modules disagree. A BUY on Trend Confirmation while Trend Core is still falling below -2 and price rides the lower Channel Pro boundary. Mixed signals mean the market has not decided.
- The timeframes disagree. A 30m or 1H signal against the 4H trend is usually a pullback, not a new trend. At the right edge of the examples, 30m and 4H are on a SELL while 1H is on a BUY, which is a reason to wait.
- Choppy, sideways market. Trend Confirmation's line is flat, labels alternate every few candles, and Trend Core hovers around 0. On the 30m example, three CONFIRM labels printed within two hours on the 24th, and on the 4H example a CONFIRM BUY and CONFIRM SELL printed a day apart on the 14th to 15th. Trend signals lose their edge here.
- Chasing a saturated move. Trend Core is already saturated (beyond ±8 by default) and price is pressed against a Channel Pro boundary. You would be entering late, after the easy part of the move.
- Inside a squeeze with no signal. The channel is tight but nothing has broken out. Wait for the direction.
- The candle has not closed. Labels and readings on a forming candle can still change.
- Around major news. Big announcements can push all three modules to extremes in a single candle. Let the market settle first.
Alerts for the full system
You do not need to watch the chart all day. A small set of alerts tells you when it is worth looking.
| Module | Alert | Why |
|---|---|---|
| Trend Confirmation | Confirmed Buy Alert and Confirmed Sell Alert | Confirmed trend flips. Your main trade prompts. |
| Trend Confirmation | Buy Alert and Sell Alert (optional) | Early flips. Only if you trade early entries. These also fire on confirmed flips, so expect duplicates. |
| Trend Core | Trend crossing up 10 and crossing down -10 | Saturation. Time to protect profits and stop chasing. Trend Core also has preset saturation alerts. |
| Trend Core | Trend crossing 0 (optional) | Control is shifting between buyers and sellers. |
| Channel Pro | Price crossing the upper or lower boundary | Breakouts, especially useful during a squeeze. |
Set each alert to Once per bar close, and create the same set on both 1H and 4H if you use the two-timeframe workflow. When an alert fires, open the chart and run through the checklist before acting. An alert is a prompt to look, not an instruction to trade.
Step-by-step setup for each alert is in the individual module guides.
- TradingViewnowWhip Trend ConfirmationConfirmed Buy Alert · NQ1! · 1H
- TradingView12m agoWhip Channel Pro + S/RPrice crossed R1 1H/4H at 84,700
- TradingView1h agoWhip Trend CoreTrend crossing down -10 · XAUUSD · 4H
FAQ
Getting started
Do I need all three indicators?
No. Each works on its own. Together they cover strength, timing and location, which gives you a much clearer read than any one alone.
If I only use one, which should it be?
Whip Trend Confirmation, because it gives the signals. Add Trend Core next for strength, then Channel Pro for location.
What is the fastest way to learn the system?
Work through the example charts in this guide in order: the 1H walkthrough in Reading the example chart, then the 4H and 30m tables. Then open your own market, scroll back, and read each stretch the same way: the label, the Trend Core reading, and where price sat in the channel. For live charts, use the worksheet in Analyze your own charts.
Do I need to change any settings?
No. The defaults work on every market and timeframe.
Which markets does the system work on?
Crypto, forex, indices, stocks and commodities.
Reading signals
What is the difference between BUY and CONFIRM BUY?
BUY is an early signal. The trend has flipped, but the bigger trend has not caught up yet. CONFIRM BUY means the flip and the bigger trend agree. BUY gives a better price with more risk. CONFIRM BUY gives a stronger setup with a later entry. The same applies to SELL and CONFIRM SELL.
Are plain BUY / SELL labels always just pullbacks?
No. On the 1H example, the SELL on the 22nd was a pullback. On the 4H chart, the plain SELL on Sep 4 started a ten-day slide from about 82,000 to 76,000. A plain label is an early warning. Judge the follow-through with Trend Core and the higher timeframe.
What is the strongest setup?
A CONFIRM label on both 1H and 4H, Trend Core moving strongly in the same direction without being saturated, and price near the Channel Pro center line with room to run. The breakout on the 21st in the 1H example had all three.
I got a CONFIRM SELL and Trend Core is at -9. Should I sell?
You would be selling late, into a stretched move. Many traders skip it or size down. Instead, watch for a flip: the first BUY on 1H and a CONFIRM BUY on 4H.
Trend Core is at -10. Will the trend flip?
Not necessarily. Saturation means the move is stretched, not that it will turn. In our testing, stretched moves in trending markets such as Bitcoin and gold often kept going, while range-bound markets such as EUR/USD pulled back more often. On the 4H example, the first CONFIRM BUY after the mid-September lows failed within a day, and the lasting move started on the 18th. Wait for the label on Trend Confirmation.
Price touched the Channel Pro boundary. Is that a reversal?
Not by itself. On the 1H example, price rode the upper boundary to the high on the 21st, which was strength, then was rejected at it on the 23rd, which was a warning. Check Trend Core and Trend Confirmation to see which one you are looking at.
Why did I get three labels in a row within a few hours?
The market is too volatile to read. On the 30m example, a CONFIRM BUY, a CONFIRM SELL and another CONFIRM BUY printed within two hours on the 24th. Step back to 1H and 4H until the labels stop flipping.
The modules disagree. What do I do?
Wait, or trade much smaller. Disagreement usually means the market has not made up its mind.
Timeframes
Which timeframes should I use?
Decide direction on 4H, confirm on 1H, and use 30m only to time the entry.
Why do the timeframes show different things right now?
They measure different-sized trends. At the right edge of the examples, 30m and 4H are on a SELL and 1H is on a BUY. Trend Core reads about -1.3 on 30m, +1 on 1H and +6 on 4H. None has a confirmed signal the others agree with, so the system says wait.
Why was the drop a downtrend on 1H but only a pullback on 4H?
On 1H, the drop on the 23rd printed a CONFIRM SELL and Trend Core fell to around -6. On 4H, it printed only a plain SELL and Trend Core stayed around +6. The short-term trend turned, but the bigger uptrend held.
Is 30m better because it is faster?
Faster, not better. On the example, 30m caught the bottom almost a day before 1H, but it also printed the most noise. Use it for timing, not for deciding direction.
Why is my 4H entry worse than the 1H signal?
The 4H waits for the move to prove itself. That confirmation costs part of the move, in exchange for a higher-quality signal.
Can I use other timeframes?
Yes. The same pairing works with 15m and 1H for day trading, or 4H and Daily for swing trading.
Technical
Do the indicators repaint?
Labels and readings on the candle that is still forming can change. Once a candle closes, its values are final. Always act on closed candles and set alerts to Once per bar close.
Can I get alerts on my phone?
Yes. Create TradingView alerts on the indicators and turn on app notifications. See the alerts section above.
Can I automate trades with the alerts?
TradingView alerts support webhooks, so you can send them to other tools. You are responsible for anything you automate. Test thoroughly before using real money.
Do the indicators set stops and targets?
No. Many traders use the Channel Pro boundaries and center line as reference points for stops and targets, but the decision is yours.
What is the win rate?
We do not publish one. Results depend on the market, timeframe, and how you manage entries, exits and risk. Scroll back through history on your own markets to see how the system behaves before trading it live.
Access
How do I get access?
All three are invite-only scripts on TradingView. Buy access at whipalgo.com, or request access at whipalgo.com/contact.
Where can I learn more about each indicator?
Each module has its own user guide covering every line, setting and alert in detail, with its own example charts.
Disclaimer and access
Disclaimer. The Whip indicators do not predict future price movement and do not guarantee any result. We are not financial advisors. They are provided for educational and technical analysis purposes only. Use them alongside your own analysis and proper risk management, and never risk money you cannot afford to lose.
Access. Whip Trend Confirmation, Whip Trend Core and Whip Channel Pro are invite-only scripts on TradingView. To buy access, go to whipalgo.com. To request access or ask a question, go to whipalgo.com/contact. Once access is granted, find them under Indicators, then the Invite-only scripts tab, and add them to your chart.