Key takeaways
- The center line is fair value. Near a boundary, price is stretched; at the center, it has room both ways.
- A squeeze (a very narrow channel) often comes before a big move. Wait for a close outside the channel and a signal.
- R1 and S1 are the nearest levels. Confluence levels, such as (1H/4H), are usually the strongest.
- Place the stop beyond a level the market respects and targets at the next levels.
- Dashed levels were recently crossed. Faint levels have not been touched for a long time.
Overview
Whip Channel Pro + S/R shows you where price sits within its normal volatility range, whether the market is about to get quiet or explosive, and where the nearest support and resistance levels are. It draws an adaptive channel around price that widens when the market heats up and tightens when it calms down, and marks the key levels above and below price from your chart and from higher timeframes, such as 30m, 1H and 4H.
Where Trend Confirmation tells you when the trend flips and Trend Core tells you how strong it is, Channel Pro tells you where price is: near the middle with room to move, or stretched out to the edge of its range.
Use it to answer three questions before you enter:
- Is price stretched? Pressed against a boundary, or sitting comfortably inside the channel.
- Is volatility expanding or contracting? A market waking up, or one going quiet.
- Is a breakout building? A tight, narrowing channel often comes before a big move.
- Where are the nearest levels? The support below and resistance above that are most likely to stop price, so you can plan your entry, stop and target.
It sits directly on the price chart and works on crypto, forex, indices, stocks and commodities, on any timeframe.
Why traders use it:
- See at a glance whether price is stretched. Near the center line, there is room to move. Pressed against a boundary, you would be entering late.
- Spot squeezes early. A tight channel is a heads-up that a bigger move may be coming, so you are ready when it breaks.
- Multi-timeframe support and resistance on one chart. See the 30m, 1H and 4H levels while you trade 30m, without switching charts. Levels that line up across timeframes are highlighted.
- Plan stops and targets with real levels. Place your stop beyond the nearest support or resistance and your target at the next level, instead of guessing.
- Completes the Whip system. Trend Confirmation gives the signal, Trend Core the strength, and Channel Pro the location and the levels.
- Works out of the box. The defaults work on every market. Change the timeframes only if you trade much faster or slower charts.
What you see on the chart: the channel
| Element | What it tells you |
|---|---|
| Black center line (Basis) | The market's current fair value. Price tends to return to it after stretching away. Its slope shows short-term direction. |
| Upper purple boundary | The top of the normal range. Price near or above it is stretched to the upside. |
| Lower purple boundary | The bottom of the normal range. Price near or below it is stretched to the downside. |
| Shaded channel (light purple) | The active volatility range. How wide it is tells you how volatile the market is right now. |
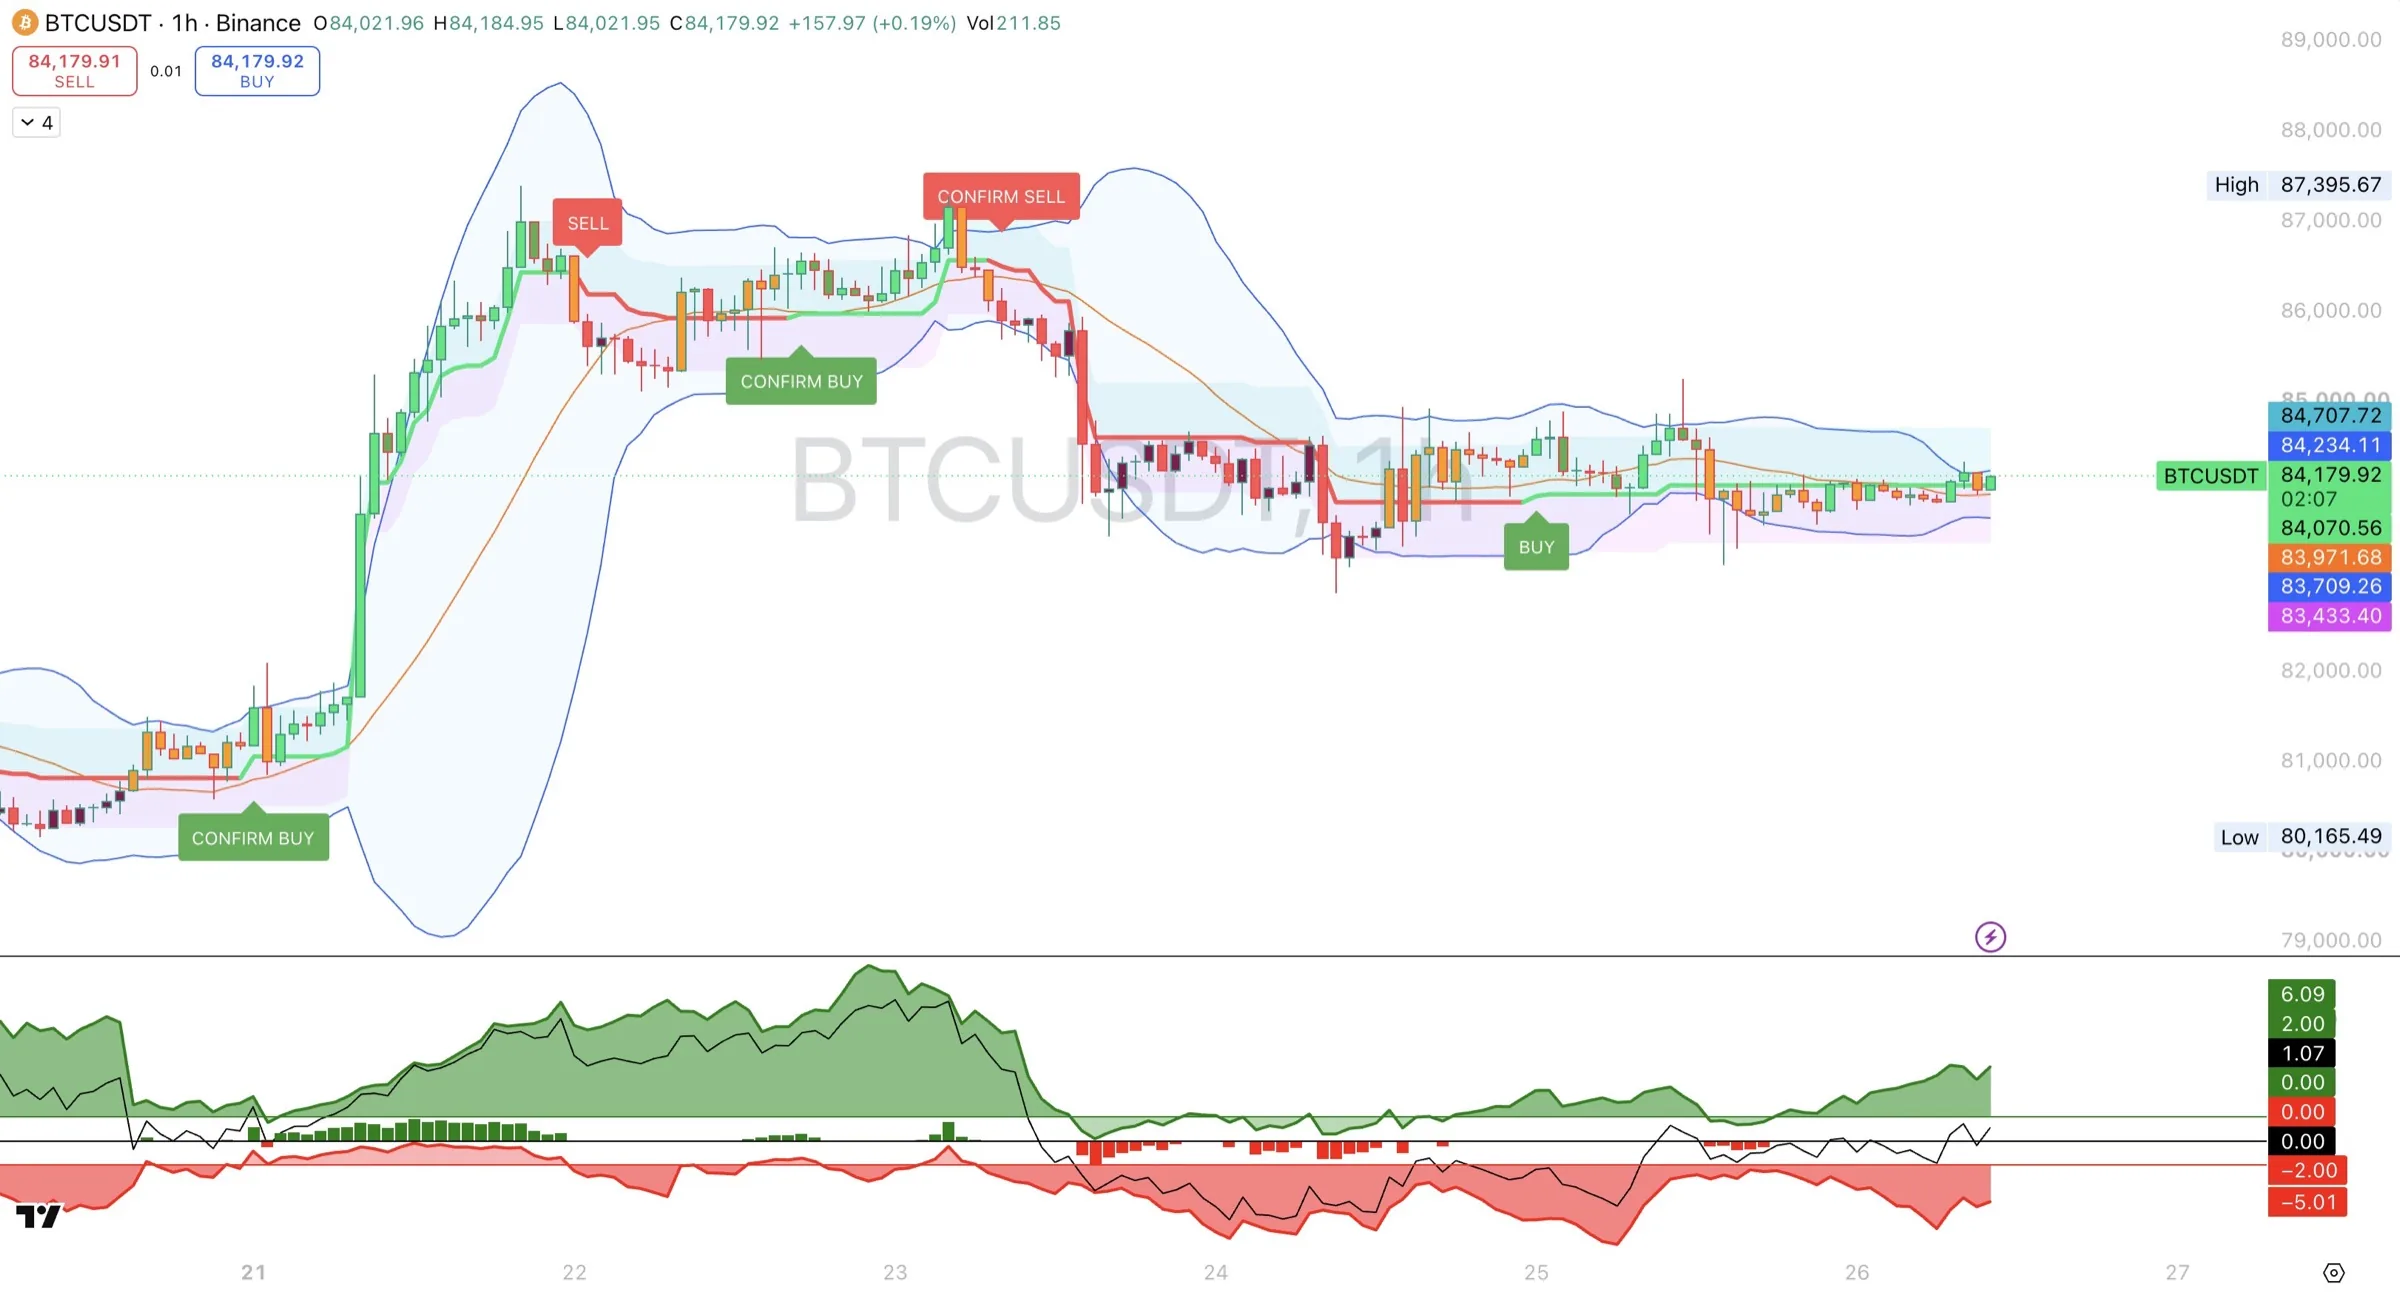
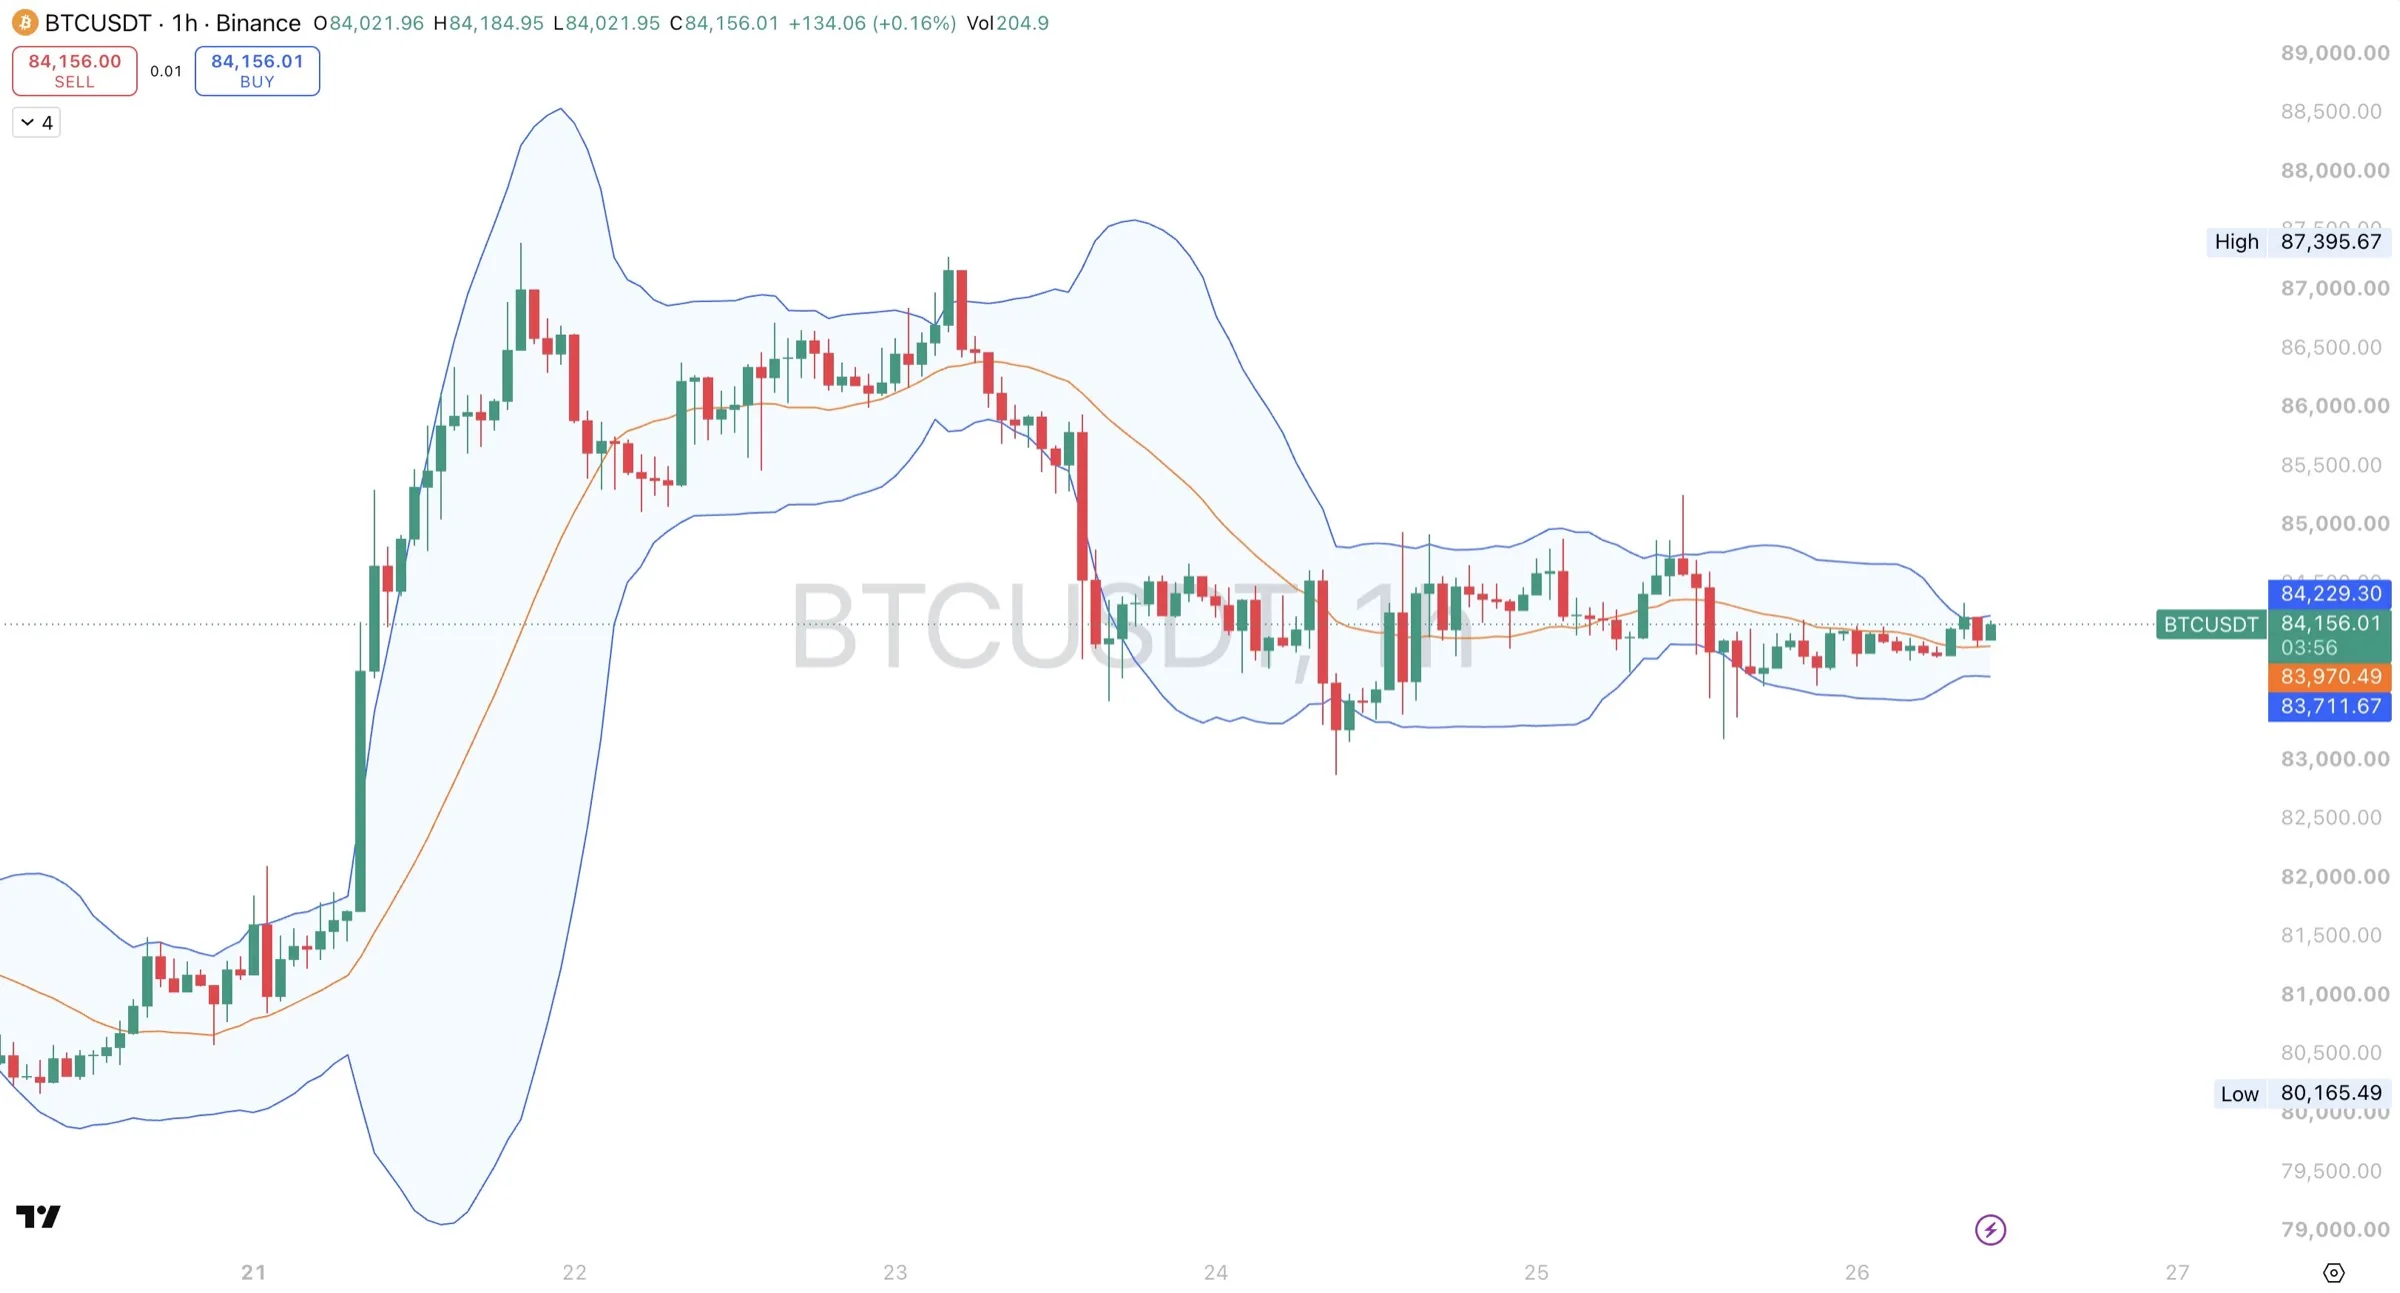
The example screenshots in this guide were taken before the color update, so on them the center line is orange and the boundaries are blue. The right-hand scale shows the live values. On the screenshot, the latest bar reads about 84,229 for the upper boundary, 83,970 for the center line and 83,712 for the lower boundary. That is a channel only about 520 wide, compared with roughly 9,500 at its widest during the rally on the 21st to 22nd.
Reading the channel
Five patterns cover most of what the channel tells you.
| Pattern | What you see | What it usually means |
|---|---|---|
| Squeeze | The channel narrows to one of its tightest widths in a while | The market is quiet and coiling. A bigger move is often coming, but the squeeze does not tell you which direction. |
| Expansion | The channel suddenly widens as price breaks out | A new move has started. Volatility and momentum are rising. |
| Riding a boundary | Price keeps closing near or beyond one boundary, candle after candle | A strong trend. Touching the boundary here is a sign of strength, not a reversal. |
| Return to center | Price leaves a boundary and drifts back to the orange line | The push is cooling. The center line often acts as support in an uptrend and resistance in a downtrend. |
| Rejection at a boundary | Price pokes past a boundary and closes back inside, in a flat or sideways channel | A possible turn back toward the center, especially when the channel is not expanding. |
A boundary touch means different things in different markets. In a trending market with an expanding channel, a touch of the boundary in the trend's direction is strength. In a flat, sideways channel, the same touch is more likely to reverse. This is why Channel Pro works best alongside Trend Confirmation and Trend Core, which tell you which kind of market you are in.
Reading the example chart
The screenshot covers about six days of BTCUSDT on the 1-hour chart, and it shows every pattern above. Reading left to right:
| When | What Channel Pro showed | What it meant |
|---|---|---|
| 20th | Channel tightened to under 1,000 wide near 81,000 | Squeeze. The market was quiet and coiling. |
| 21st | Price broke out of the top and the channel blew open to roughly 9,500 wide. Price rode the upper boundary to the 87,395 high. | Expansion and a strong trend. Touching the upper boundary here was strength, not a sell signal. |
| 22nd | Price left the upper boundary and pulled back to the center line near 85,500, which held | Return to center. The push cooled and the center line acted as support. |
| 23rd | Price pushed back to the upper boundary near 87,200 while the channel was flat, and was rejected | Rejection at a boundary. A sign the rally was running out of room. |
| 23rd to 24th | Price broke below the center line and rode the lower boundary down to near 82,900 as the channel widened again | A new downtrend. Touching the lower boundary here was weakness, not a buy signal. |
| 25th | Price climbed back to the center line and the channel started narrowing | The drop cooled off. |
| 25th to 26th | Channel shrank to about 520 wide around 84,000, the tightest on the chart | A new squeeze. A bigger move is likely, but the channel does not say which way. |
What to take from it:
- The squeeze on the 20th came before the biggest move on the chart. A tight channel is a reason to get ready, not to act.
- Boundary touches meant opposite things in different conditions. Riding the upper boundary on the 21st was strength. Getting rejected at it in a flat channel on the 23rd was a warning.
- The center line mattered. It held as support on the 22nd, and breaking below it on the 23rd was the first sign of the drop.
- Right now, the channel says wait. The squeeze on the 25th to 26th has not broken yet. Watch for the channel to widen, and for Trend Confirmation and Trend Core to agree on the direction.
Support and resistance levels
Alongside the channel, Channel Pro + S/R marks the key price levels around you. Resistance levels sit above price, support levels sit below it, and each one is labeled so you know exactly what you are looking at.
What you see on the chart
| Element | What it tells you |
|---|---|
| R1, R2, R3 … (dark lines above price) | Resistance levels. R1 is the closest above price, R2 the next, and so on. These are prices where sellers have stepped in before. |
| S1, S2, S3 … (purple lines below price) | Support levels. S1 is the closest below price, S2 the next, and so on. These are prices where buyers have stepped in before. |
| The price on each label | The exact level, so you can place orders without guessing. |
| The tag in brackets, such as (30m), (1H) or (4H) | Which timeframe the level comes from. Levels from higher timeframes usually matter more. |
| A combined tag, such as (1H/4H) | A confluence level: more than one timeframe agrees on it. These are drawn thicker and darker, and are usually the strongest levels on the chart. |
| Dashed line that stops partway | Price has recently crossed this level, and the line stops where it crossed. Old support often becomes resistance and old resistance often becomes support, so watch how price reacts when it comes back. |
| Fainter line | Price has not reacted to this level for a long time. It may matter less now. |
| [flip] or *stale on the label (optional) | Text versions of the two above. They are off by default; switch them on under Label layout if you prefer the words on the label. |
| x3, x5 … after the label (optional) | How many times price has turned near this level. More touches usually means a stronger level. |
| PDH, PDL, PWH, PWL, Day (optional) | Previous day high and low, previous week high and low, and today's high and low. |
| Round (optional) | Round-number prices, such as 84,000 or 85,000, where many traders place orders. |
Levels are best read as zones rather than exact prices. Price often turns slightly before a level or pokes slightly past it.
Choosing your timeframes. By default, the levels come from your chart plus 30m, 1H and 4H. Set the three timeframes to match how you trade, usually your trading timeframe and the next two above it:
| You trade on | Set the level timeframes to |
|---|---|
| 1m or 5m | 5m, 15m and 1H |
| 15m | 15m, 1H and 4H |
| 30m | 30m, 1H and 4H (the default) |
| 1H | 1H, 4H and Daily |
| 4H | 4H, Daily and Weekly |
A timeframe that is lower than your chart is skipped automatically, so on a 4H chart the 30m and 1H levels will not appear even if they are switched on.
Keep it readable. The default shows up to 10 levels on each side. Most traders find 3 to 5 per side easier to read. Lower Levels per side in the settings, or set a Max distance filter so only levels near price are shown.
Using the levels for entries, stops and targets
The levels tell you where to act. The other two Whip indicators tell you whether to act.
For a buy:
- Wait for BUY or CONFIRM BUY on Trend Confirmation, with Trend Core rising and not saturated.
- Entry: the best entries come near a support level, especially a confluence level or one that sits close to the Channel Pro center line or lower boundary. Avoid buying right under a resistance level.
- Stop: place it beyond the support level you are buying from, not exactly on it, so a small poke through does not stop you out.
- Target: use the next resistance level above (R1), and R2 for a second target. If R1 is very close, the trade may not have enough room.
- Check the trade is worth it: compare the distance to your target with the distance to your stop. Many traders want the target to be at least 1.5 to 2 times further away than the stop.
For a sell: the same steps in reverse. Enter near resistance after a SELL or CONFIRM SELL, place the stop beyond that resistance, and target the next support levels (S1, S2).
How to read levels with the other modules:
| What you see | What it usually means |
|---|---|
| CONFIRM BUY near a support confluence level, Trend Core rising | A strong setup with a clear place for the stop. |
| CONFIRM BUY with a resistance level just above price | Little room to run. Wait for price to break and hold above that resistance, or skip the trade. |
| Price breaks a resistance level (the line turns dashed), then price comes back to it and holds | Old resistance acting as new support. A common continuation entry. |
| Trend Core saturated and price at a 4H resistance level | Two separate signs the move may be running out of room. Protect profits. |
| Squeeze on the channel with support and resistance close on both sides | The market is boxed in. A break of either level, with a signal in the same direction, often starts the next move. |
Use higher-timeframe levels for the big picture. A 4H or confluence level is a much bigger obstacle than a 30m level. When you trade 30m, use the 30m levels for precise entries and stops, and the 1H and 4H levels for targets and for spotting where the trade could stall.
Using it with Trend Confirmation and Trend Core
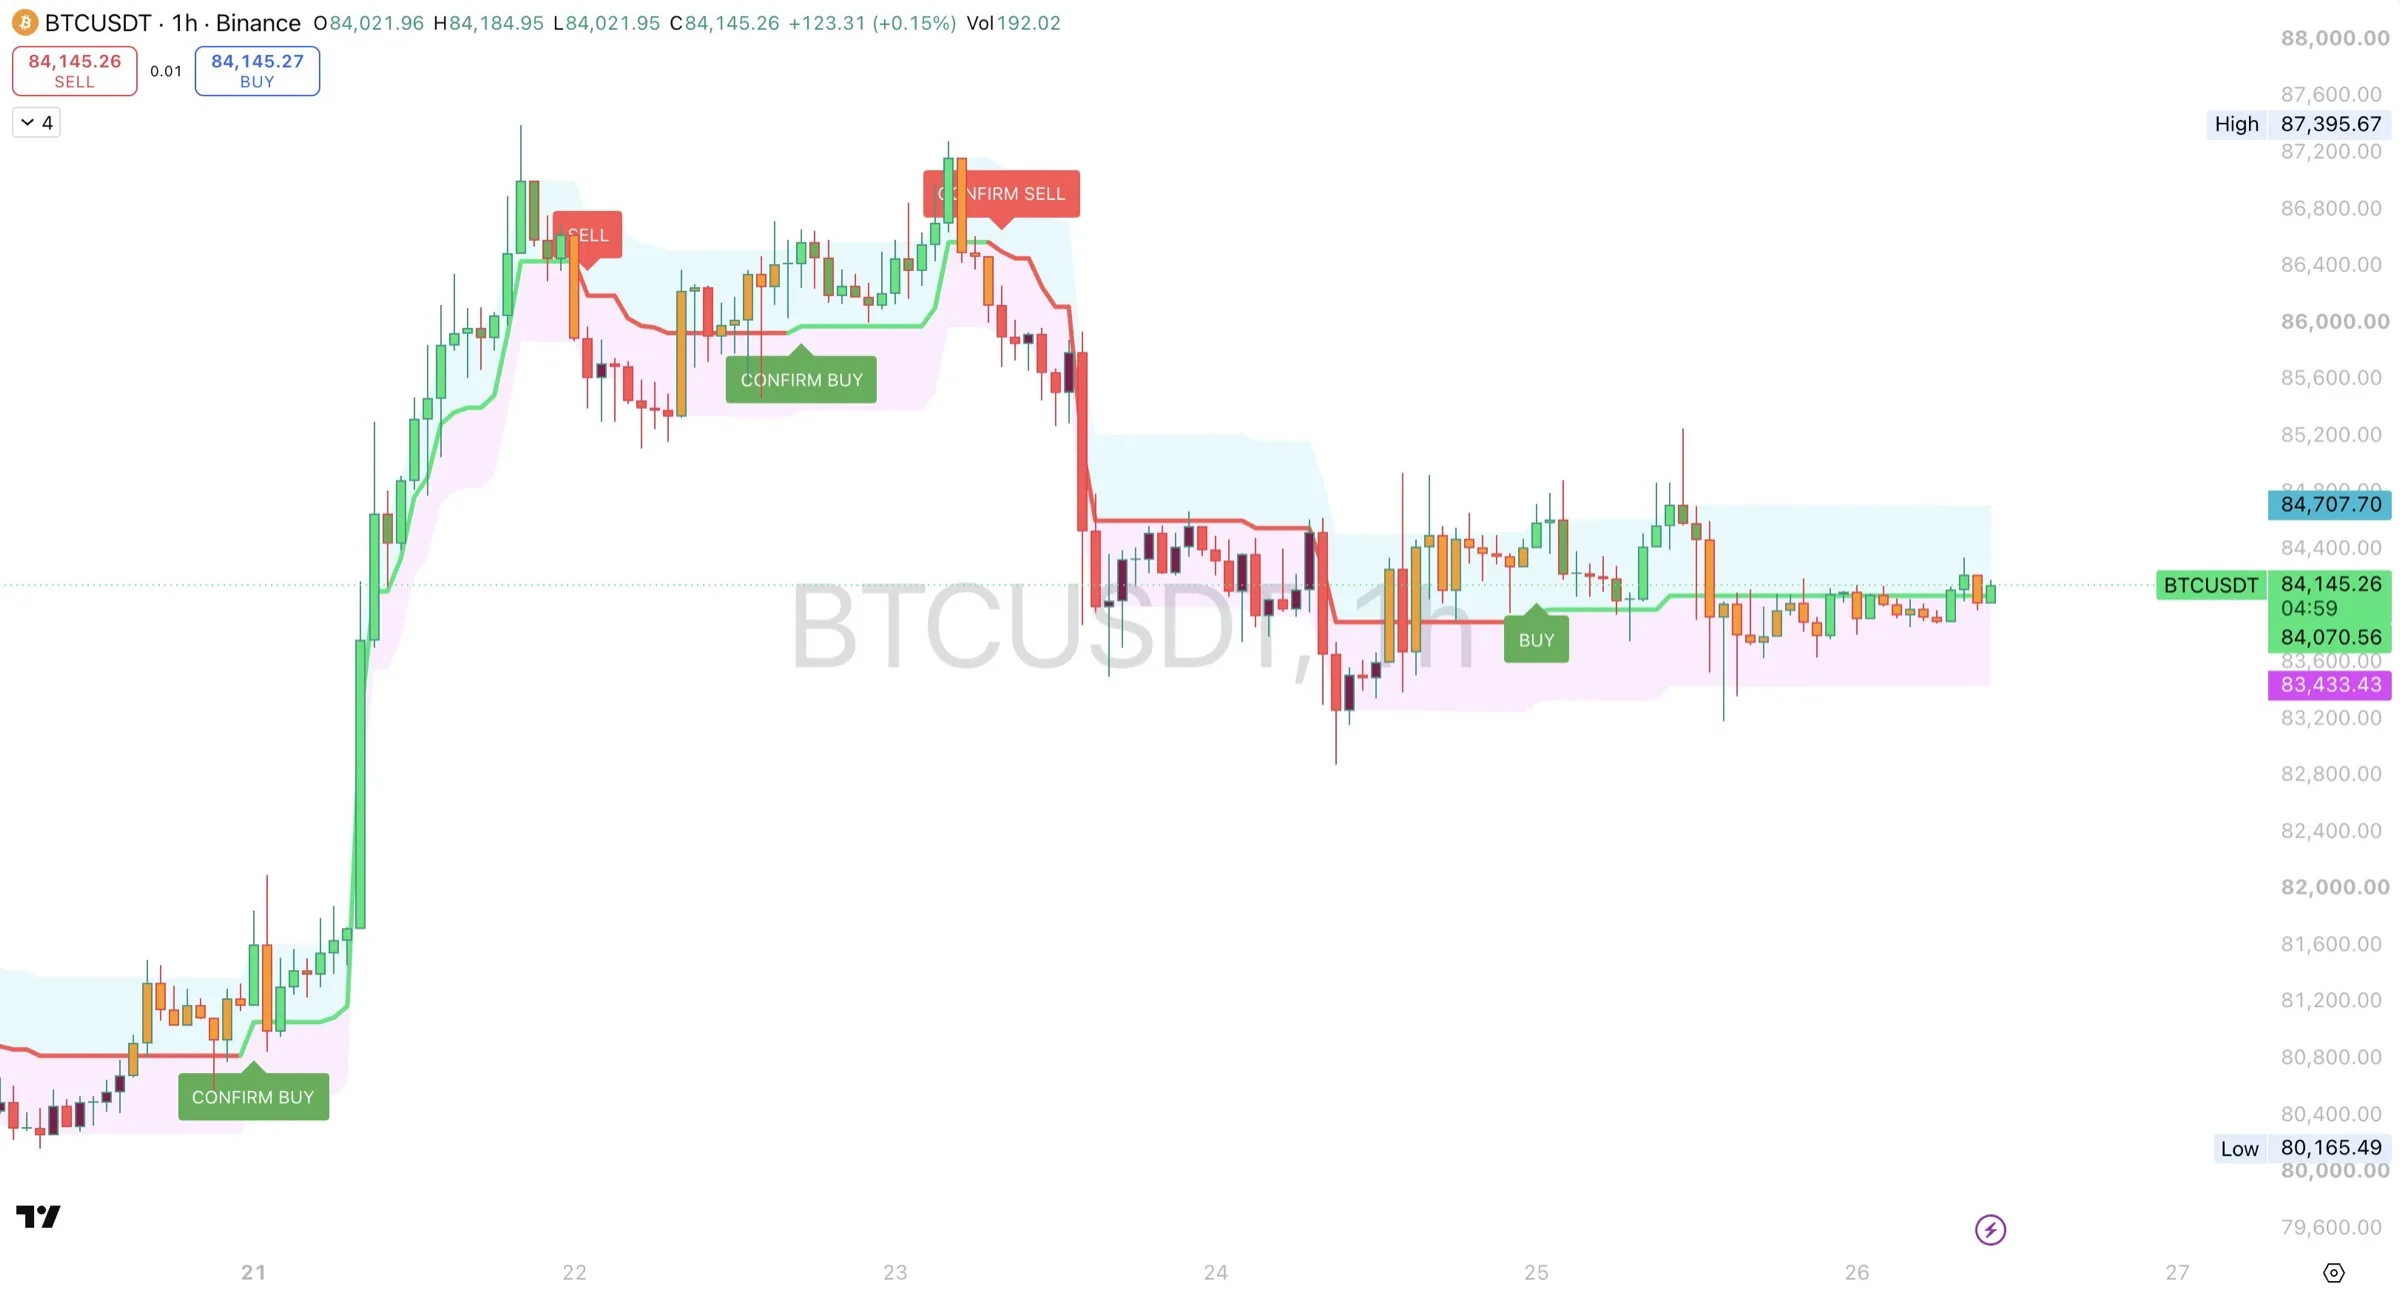
Channel Pro is the location layer of the Whip system. Trend Confirmation gives you the signal. Trend Core tells you the strength. Channel Pro tells you whether price is in a good place to act.
With Whip Trend Confirmation:
| Signal | Where price is in the channel | What it usually means |
|---|---|---|
| CONFIRM BUY | Near the center line or lower half, channel starting to widen | Good location. Room to run toward the upper boundary. |
| CONFIRM BUY | Already pressed against the upper boundary | Late entry. Consider waiting for a pullback toward the center line. |
| BUY after a big drop | At or below the lower boundary, channel very wide | Stretched to the downside. Early reversal attempt, higher risk. |
| CONFIRM SELL | Near the center line or upper half, channel starting to widen | Good location. Room to fall toward the lower boundary. |
| CONFIRM SELL | Already pressed against the lower boundary | Late entry. Consider waiting for a bounce toward the center line. |
| SELL after a big rally | At or above the upper boundary, channel very wide | Stretched to the upside. Early reversal attempt, higher risk. |
| Any signal | Inside a squeeze | The signal may mark the start of the breakout. Watch for the channel to expand in the signal's direction. |
With Whip Trend Core:
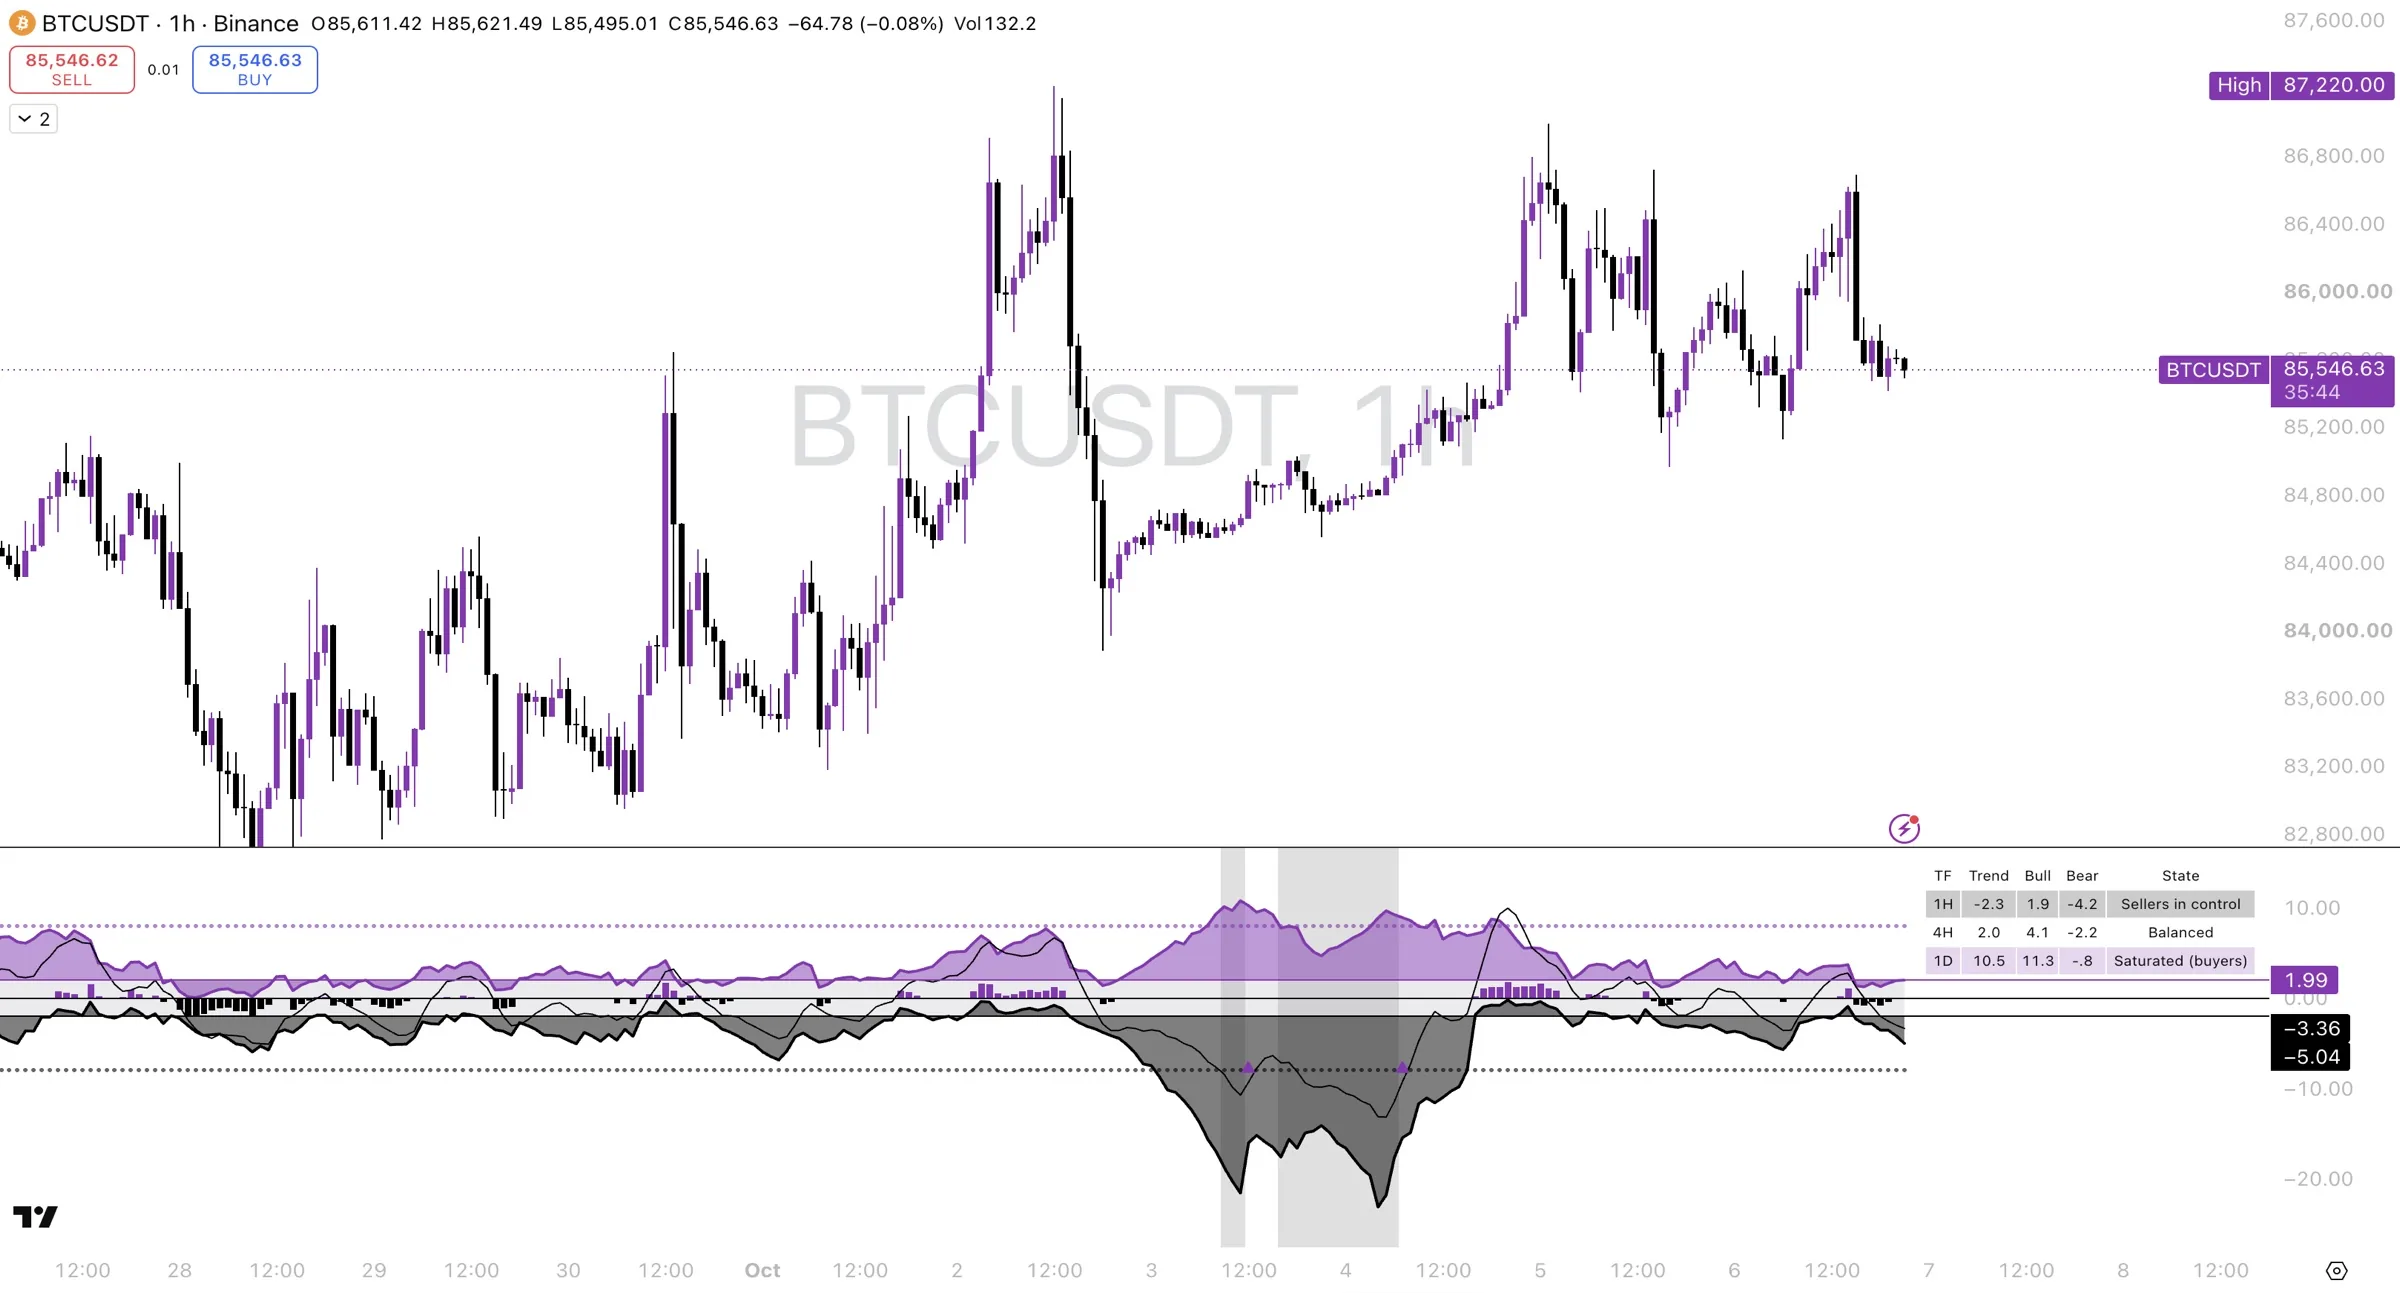
- Trend Core saturated and price at a boundary. Around -8 to -10 on Trend Core with price at or below the lower boundary means the drop is stretched on both measures. A turn is getting more likely. The same applies at around +8 to +10 with price at the upper boundary.
- Trend Core strong but not saturated, price riding a boundary. A healthy trend. Do not fight it.
- Trend Core near 0 and a squeeze. Balanced and quiet. Wait for the breakout and the signal before acting.
Using the channel and levels for stops and targets. Support and resistance levels give you the most precise places for stops and targets (see Using the levels for entries, stops and targets above). The channel adds context: many traders use the opposite boundary or the center line as a target, and keep stops beyond the nearest boundary so normal volatility does not knock them out. When a support or resistance level sits close to a channel boundary, that area is usually stronger.
Check it on 30m, 1H and 4H. The same approach from the other guides applies. Use 1H (or 30m) for early signals and 4H for confirmed ones, and look at Channel Pro on both. A squeeze or a boundary touch on 4H carries more weight than one on 1H. When 1H price is stretched to a boundary but the 4H channel still has room, the bigger move usually has further to go.
Example: the same market on 30m, 1H and 4H. Here is the market from the screenshot above on two more timeframes. The 4-hour chart shows the bigger picture over about a month. The 30-minute chart zooms in on the last four days.
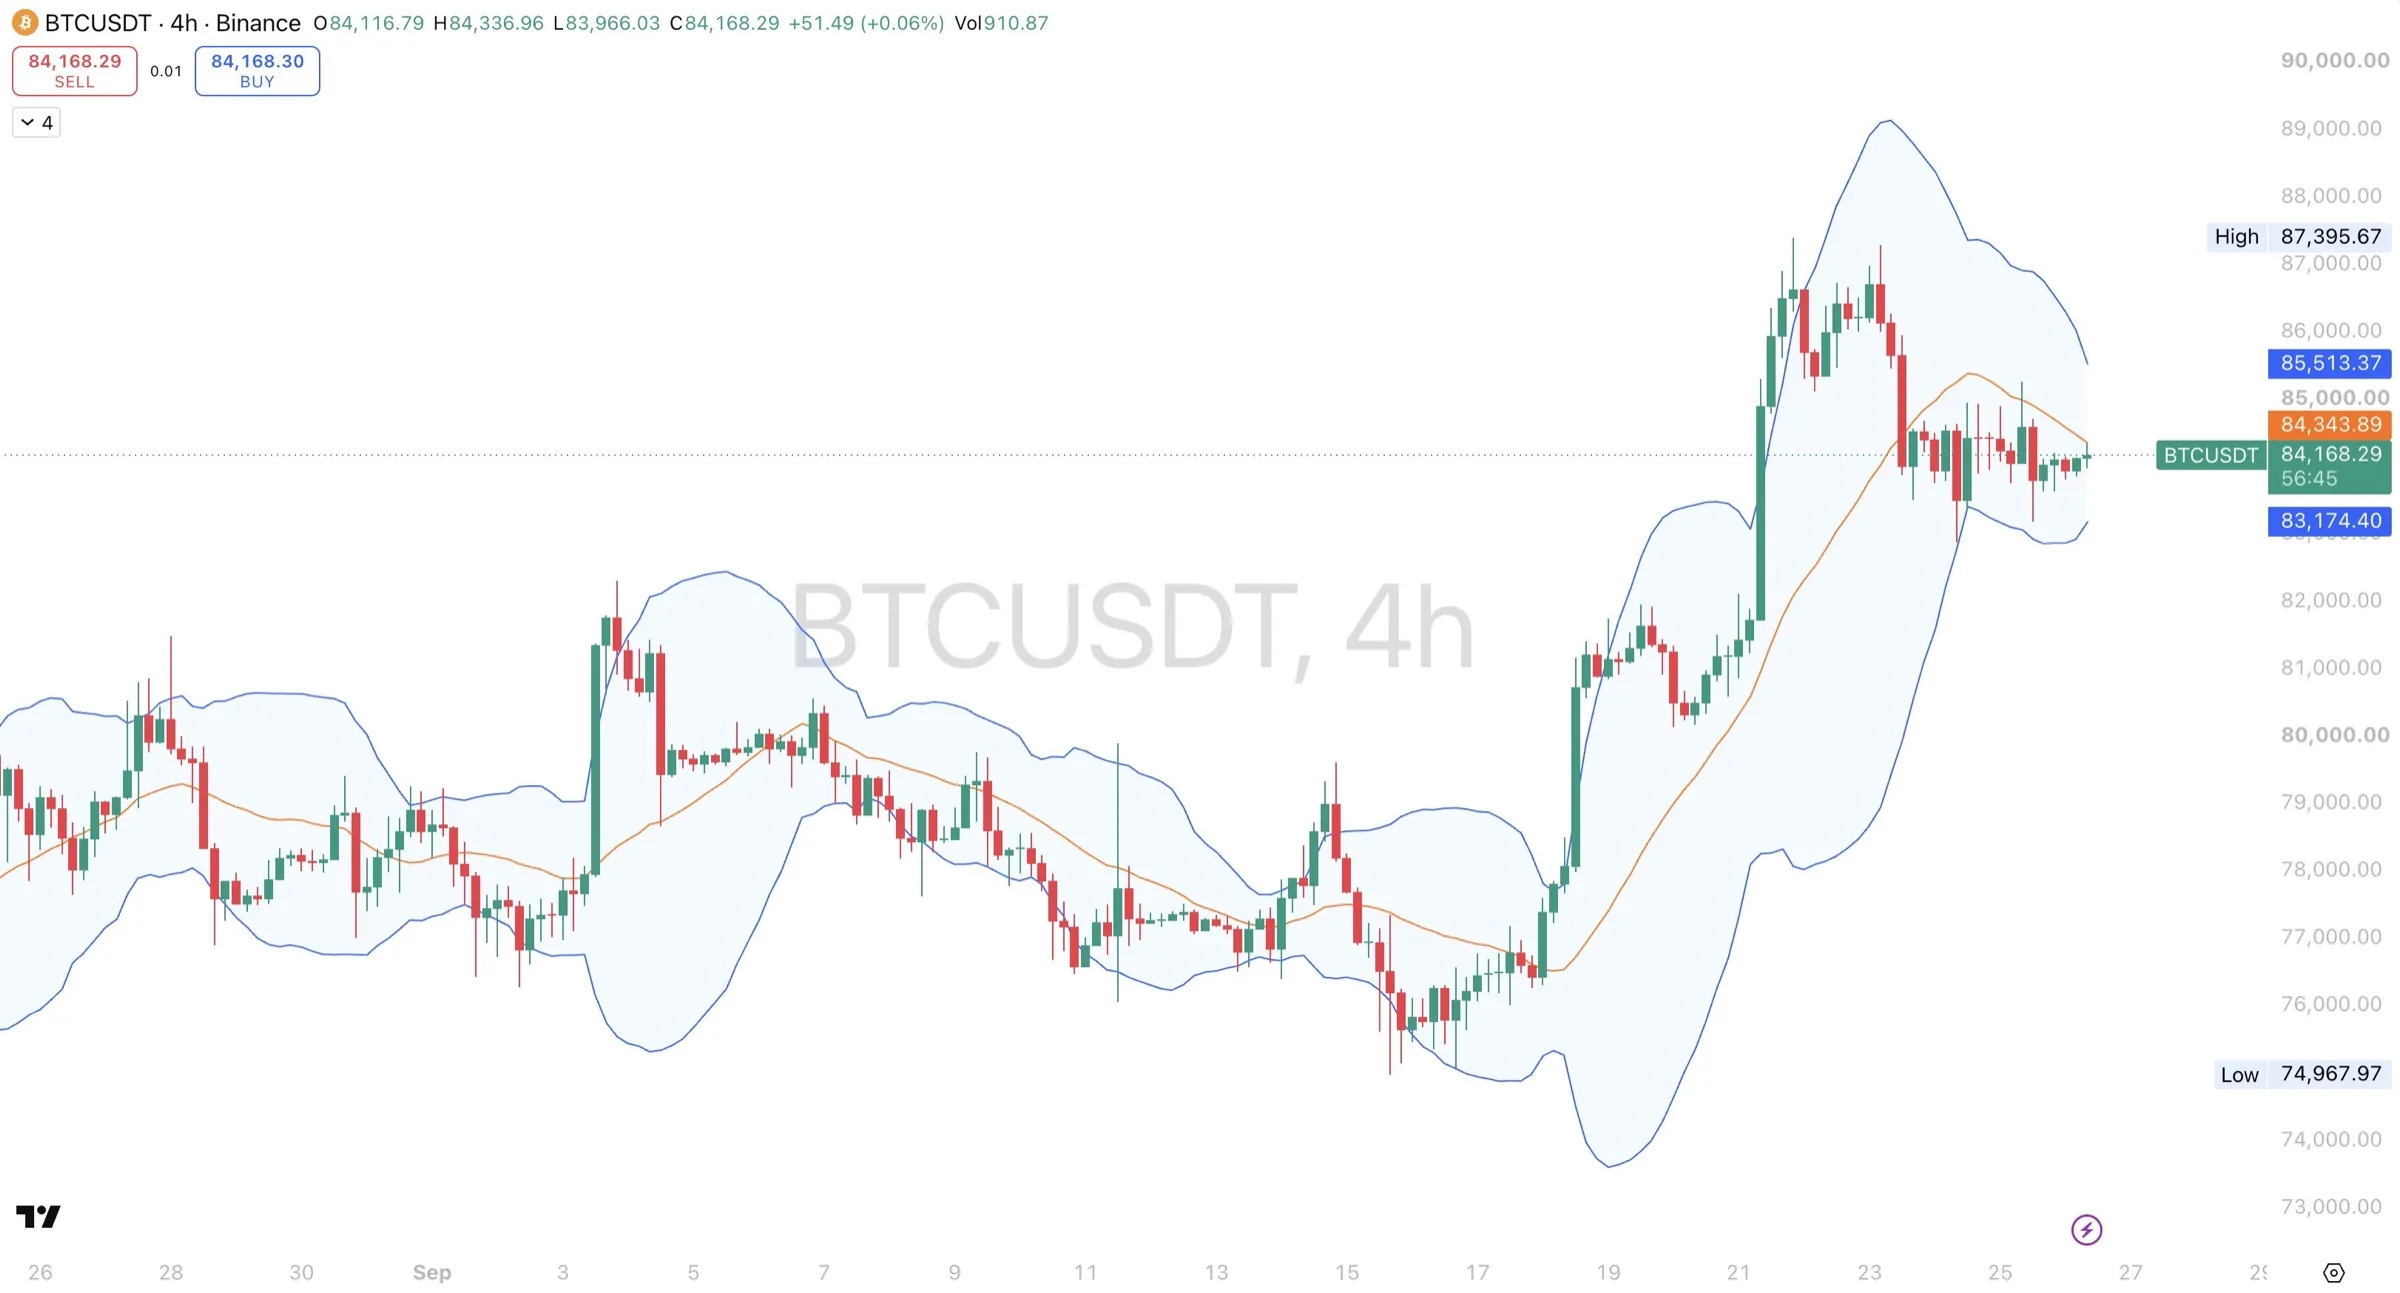
| When | 4H Channel Pro | What it meant |
|---|---|---|
| 1st to 3rd Sep | Channel tight, about 2,500 wide, then price broke through the upper boundary on the 3rd | Squeeze, then an upside breakout. |
| 4th to 12th | Price fell back from the upper boundary, crossed below the center line and drifted along the lower half | The breakout faded and sellers took over. |
| 13th | Channel narrowed to about 1,100 wide near 77,000 | A tight squeeze. |
| 14th to 16th | Price broke up to the upper boundary near 79,500, then reversed and rode the lower boundary down to the 74,968 low | A fake-out. The first break of the squeeze failed and the real move went the other way. |
| 18th to 22nd | Price broke through the upper boundary and rode it to 87,395 as the channel grew to its widest on the chart | Expansion and a strong uptrend. |
| 23rd to 26th | Price fell back through the center line and now sits between the center line near 84,300 and the lower boundary near 83,200. The channel is narrowing. | The rally has cooled and volatility is contracting. |
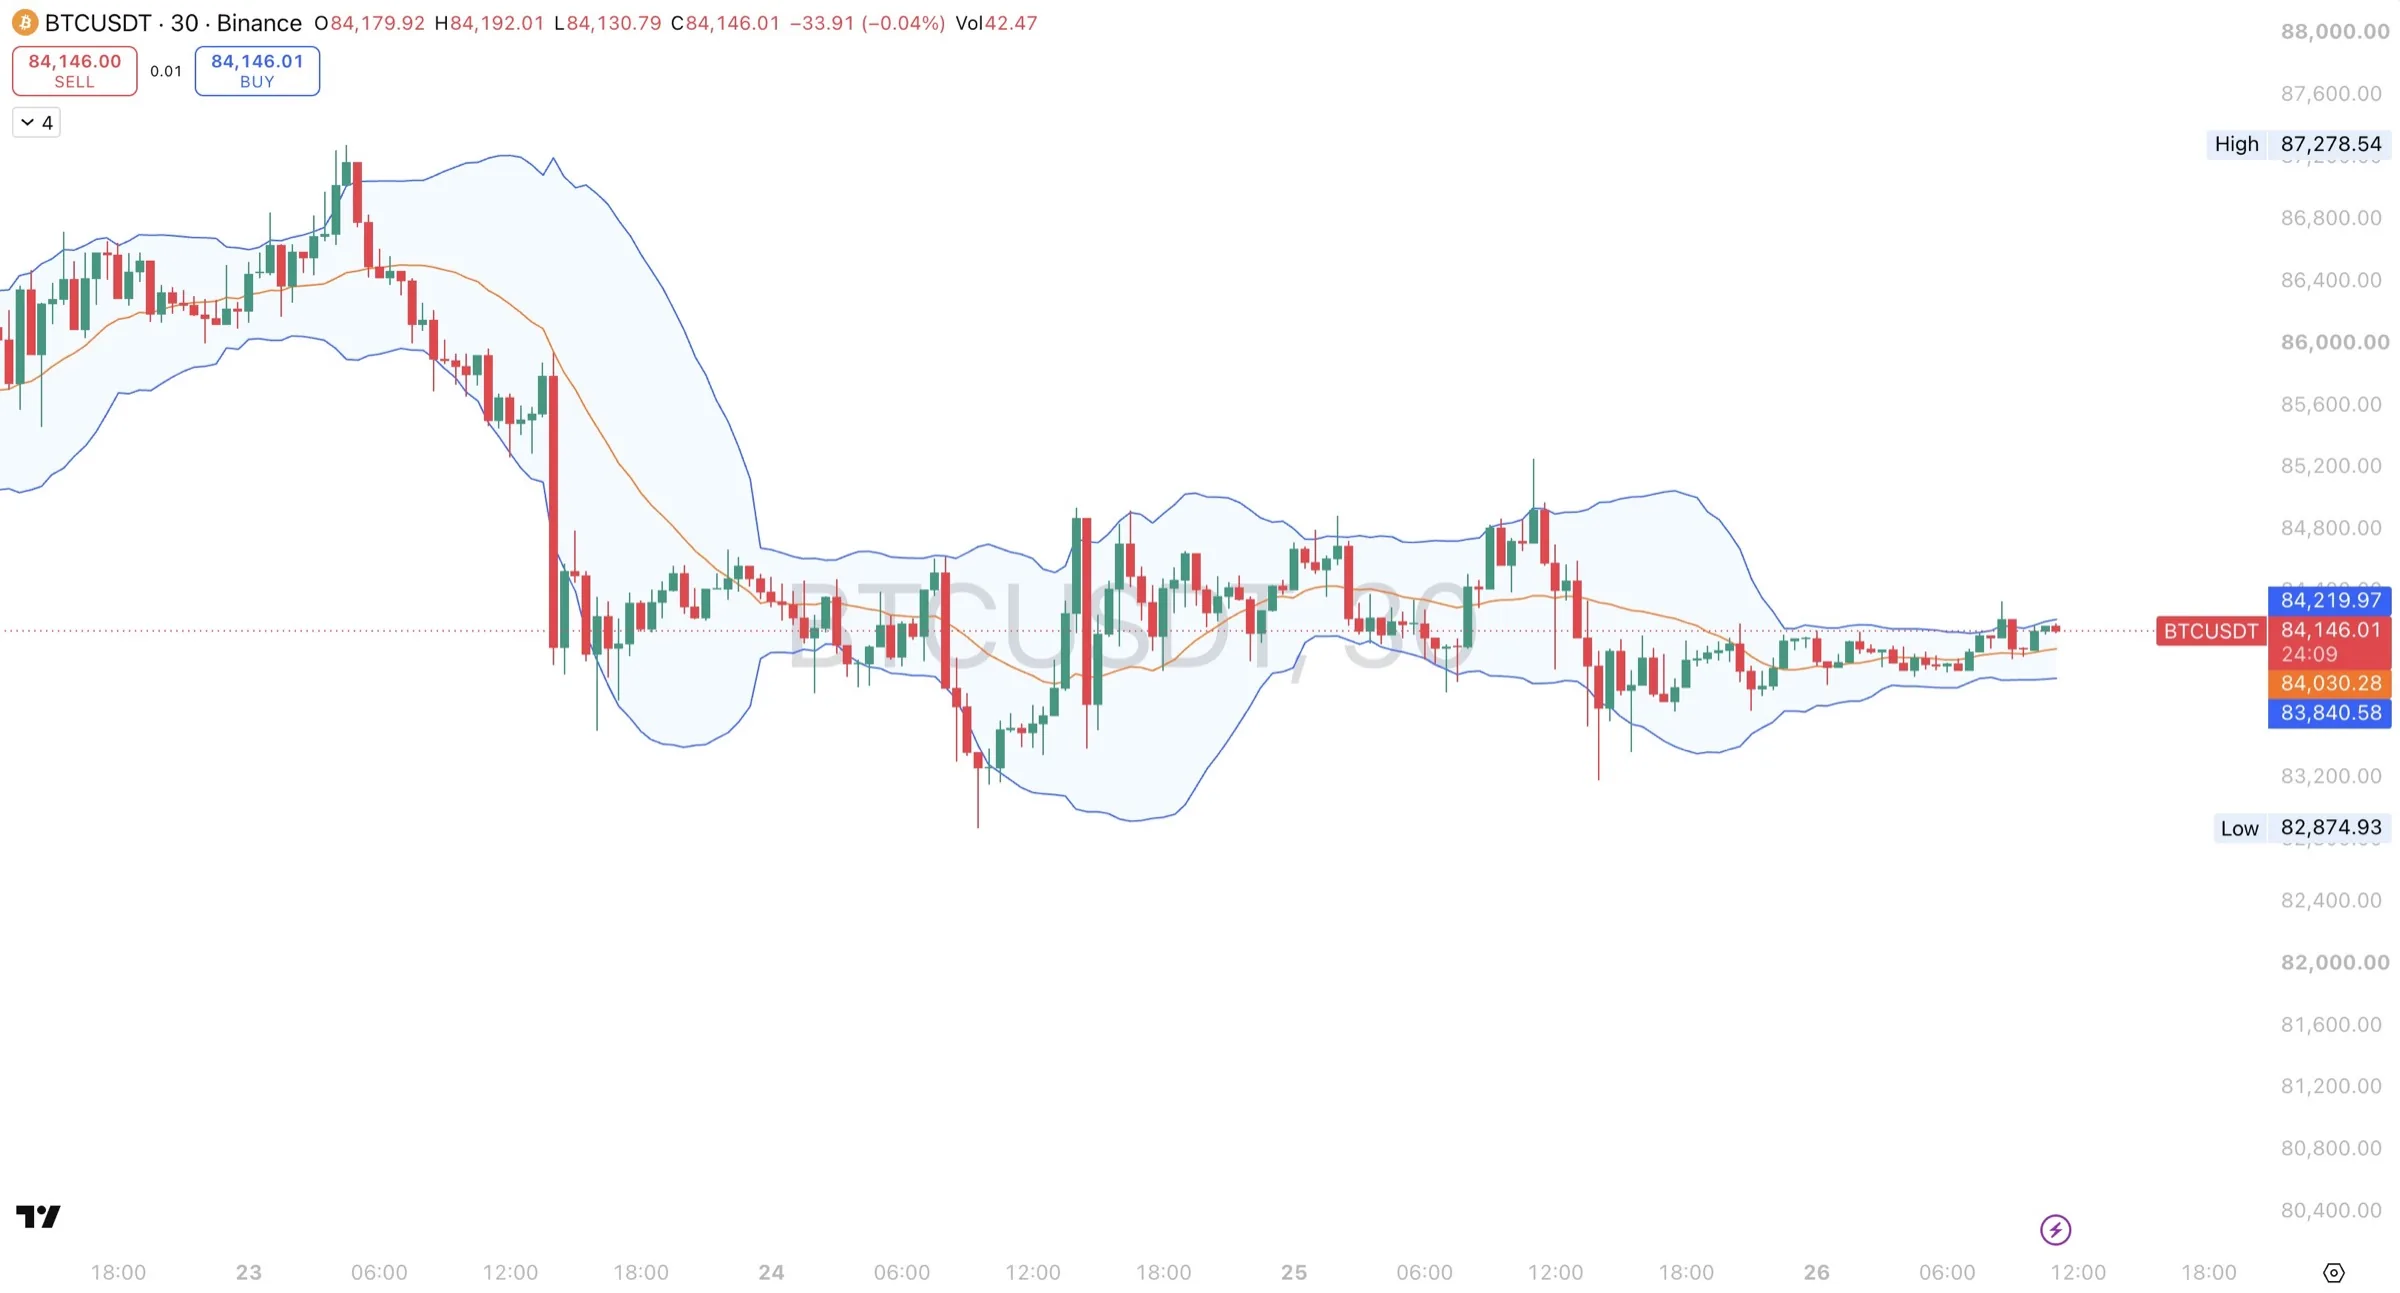
| When | 30m Channel Pro | What it meant |
|---|---|---|
| Early on the 23rd | Price pushed to the upper boundary near 87,300, then fell below the center line | The rally stalled at the top of its range. |
| Afternoon of the 23rd | One large red candle broke through the lower boundary and the channel blew open | Expansion to the downside. The drop had started. |
| 24th, morning | Price rode the lower boundary to the 82,875 low | Strong selling. |
| 24th to 25th | Price swung between the boundaries, from near 83,200 to near 85,300, with sharp wicks at both edges | A volatile range. Boundary touches reversed instead of trending. |
| 26th | Channel shrank to about 380 wide, from 83,840 to 84,220, with price on the center line | A very tight squeeze. |
How the three timeframes fit. At the right edge, all three channels are contracting at the same time:
| Timeframe | Channel width now | Where price sits |
|---|---|---|
| 30m | About 380 | On the center line |
| 1H | About 520 | On the center line |
| 4H | About 2,300 and narrowing | Between the center line and the lower boundary |
- A squeeze on every timeframe at once is worth watching closely. The market has gone quiet from the 30-minute view all the way up to the 4-hour view. The breakout, when it comes, is likely to show up on 30m first, then 1H, then 4H.
- The faster the timeframe, the earlier and noisier the signal. On the 23rd, the 30m channel broke to the downside hours before the 4H chart showed anything more than a pullback. Early, but also more likely to fake out, as the 24th to 25th range on 30m shows.
- Squeezes can fake out on any timeframe. The 4H squeeze on the 13th broke up first, then reversed into the real move down. Wait for a close outside the channel, the channel widening in that direction, and agreement from Trend Confirmation and Trend Core.
- The 4H position frames the next move. Price is below the 4H center line. An upside break on 30m or 1H has room to run back toward the 4H center line and upper boundary. A downside break would be heading toward the 4H lower boundary near 83,200, where a new 4H down move would start if price began riding it.
How Channel Pro fits the Whip system
| Module | Question it answers | What you look at |
|---|---|---|
| Whip Trend Core | How strong is the trend, and is it saturated? | The Trend line value, its direction, and the columns |
| Whip Trend Confirmation | Has the trend flipped, and is the flip confirmed? | BUY / SELL and CONFIRM BUY / CONFIRM SELL labels |
| Whip Channel Pro | Where is price, where are the key levels, and is volatility expanding or contracting? | The channel boundaries, center line, width, and the R and S levels |
Read them in this order: Trend Core for strength, Trend Confirmation for timing, Channel Pro for location. When all three agree on 1H and 4H, you have the strongest setup the system offers. When they disagree, wait, trade smaller, or skip it.
For the full workflow using all three modules together, see the Whip System Complete Guide.
Settings
The defaults work on every market and timeframe. The settings most traders change are the three level timeframes and Levels per side. Change one setting at a time and compare on past charts first.
Channel Pro
| Setting | Default | What it changes |
|---|---|---|
| Show Channel Pro | On | Turns the channel on or off. Turn it off if you only want the levels. |
| Length | 20 | How much history the channel is built from. Higher values give a slower, smoother channel. Lower values react faster. |
| Source | close | The price the channel follows. Close is the standard choice. |
| Width | 2 | How wide the channel is. Higher values give a wider channel that price touches less often. Lower values give a tighter one. |
| Offset | 0 | Shifts the channel left or right on the chart. Leave it at 0. |
Levels
| Setting | Default | What it changes |
|---|---|---|
| Sensitivity | 10 | How far back the indicator looks for levels on your own chart. Lower finds more nearby levels. Higher favors bigger, longer-term levels. |
| Transparency | 85 | How faint the level lines are. Lower makes them darker. |
| Levels per side | 10 | How many resistance levels above and support levels below are shown. 3 to 5 is easier to read. |
| ATR length | 14 | How many candles are used to measure typical candle size. This sets the scale for the distance filter, merging and touch settings. Leave it at 14. |
| Sort levels by | Distance | Distance numbers levels from nearest to farthest. Strength puts the most-tested levels first, wherever they are. |
| Max distance filter | 0 (no limit) | Hides levels further from price than this. Useful to keep the chart clean. |
| Merge threshold | 0.1 | Levels very close together are combined into one. |
Multi-timeframe levels
| Setting | Default | What it changes |
|---|---|---|
| Enable multi-timeframe levels | On | Adds levels from the three timeframes below. |
| Include TF 1 / TF 2 / TF 3 | 30m, 1H, 4H | The three timeframes the levels come from. Match them to how you trade (see Choosing your timeframes). Any timeframe below your chart's timeframe is skipped automatically. |
| Short swing length | 20 | How far back each timeframe looks for its nearer levels. |
| Long swing length | 50 | How far back each timeframe looks for its bigger levels. |
Extra levels and display
| Setting | Default | What it changes |
|---|---|---|
| Show prior day/week high-low + current day high-low | Off | Adds PDH, PDL, PWH, PWL and today's high and low. Useful for day trading. |
| Show round-number levels | Off | Adds round prices near current price. Step 0 picks a sensible step automatically. |
| Show touch count on labels | Off | Adds how many times price turned near each level, such as x4. |
| Pivot lookback / Touch tolerance | 5 / 0.25 | How turning points are found and how close price must come to count as a touch. Leave the defaults. |
| Flag recently broken levels | On | Draws a recently crossed level as a dashed line that stops at the point price crossed it. |
| Break lookback / Line back-projection | 20 / 50 | How recent a break must be to be flagged, and how far back unbroken lines are drawn. |
| Fade levels with no recent touch | On | Draws levels price has not reacted to for a long time more faintly. |
| Stale threshold | 300 | How many candles without a reaction before a level is marked stale. |
| Highlight multi-timeframe confluence levels | On | Draws levels shared by more than one timeframe thicker and darker. |
| Draw as shaded zones | Off | Shows each level as a zone instead of a line. Good for seeing levels as areas rather than exact prices. |
| Show levels table | Off | Adds a table listing every level with its timeframe, touches, how long since the last touch, and its distance from price. |
| Label layout | 0.15 / 15 | Spreads out labels that would overlap when levels are close together. |
| Show [flip] tag on labels | Off | Adds the word [flip] to recently crossed levels. The dashed line shows it either way. |
| Show *stale tag on labels | Off | Adds *stale to levels with no recent touch. The fainter line shows it either way. |
Colors. Resistance levels are black and support levels purple; the channel boundaries are purple with a black center line and a light purple fill. All five can be changed in the Colors and Channel Pro groups. If you use TradingView's dark theme, change the resistance and center-line colors to a light color so they stay visible. The Style tab also lets you turn off the shading for a cleaner chart when running all three Whip modules together.
Alerts
You can set TradingView alerts on price crossing any of the channel lines. The most useful ones:
| Alert | Condition to set | Why |
|---|---|---|
| Upside breakout | Price crossing up the upper boundary | Price is breaking out of its normal range to the upside. |
| Downside breakout | Price crossing down the lower boundary | Price is breaking out of its normal range to the downside. |
| Back to center | Price crossing the center line | The push is cooling, or a pullback has reached fair value. |
To set one up:
- Open the Alerts panel and click Create alert (or press Alt+A).
- Under Condition, choose the symbol's price first.
- Choose Crossing up, Crossing down or Crossing.
- In the next field, choose Whip Channel Pro, then the line you want (upper, center or lower).
- Set the trigger to Once per bar close, choose how you want to be notified, and save.
Breakout alerts are most useful during a squeeze, when you are waiting for the market to pick a direction.
Alerts on support and resistance levels. You can also be alerted whenever price crosses any of the levels shown on your chart:
- Open the indicator settings and switch on Alert when price crosses any shown R/S level in the Alerts section. Switch on Only alert on confirmed bar close too, for fewer and more reliable alerts.
- Open the Alerts panel and click Create alert.
- Under Condition, choose Whip Channel Pro + S/R, then Any alert() function call.
- Choose how you want to be notified and save.
Each alert tells you which level was crossed and at what price, for example "Price crossed R1 1H/4H at 84,700". Keep Levels per side low if you use this, or you may get more alerts than you want.
Limitations
- It shows location, not direction. A squeeze tells you a move is coming, not which way. Use Trend Confirmation and Trend Core for direction.
- A boundary is not a wall. In strong trends, price can ride a boundary for a long time. Selling every upper touch or buying every lower touch will go wrong in a trend.
- Levels are zones, not exact prices. Price often turns a little before a level or pokes a little past it. Leave room in your stops.
- Levels can break. Support and resistance hold until they do. A level on its own is not a signal to buy or sell. Wait for Trend Confirmation and Trend Core to agree.
- Levels update as the market moves. New highs and lows create new levels. Levels from a higher timeframe can also shift until that timeframe's current candle closes.
- Too many levels is noise. If the chart is crowded, lower Levels per side or set a Max distance filter.
- It reacts to volatility after it happens. The channel widens once a big move has started, not before.
- Squeezes can resolve with a fake-out. Price sometimes breaks one way out of a squeeze, then reverses. Wait for a close and a signal rather than reacting to the first poke.
- The live candle moves. The channel and levels on the forming candle update with price. Judge them on closed candles.
- Past behavior does not predict future moves. Use it as one input in your analysis, with proper risk management.
FAQ
Getting started
What does Channel Pro tell me?
Where price sits within its normal range, how volatile the market is right now, and when a quiet market may be about to break out.
What is the fastest way to learn to read it?
Go through the example charts in this guide: the 1H walkthrough in Reading the example chart, then the 4H and 30m tables. Then scroll back through your own market and look for the same five patterns: squeeze, expansion, riding a boundary, return to center, and rejection at a boundary.
Why are there no buy and sell labels?
Channel Pro is the location layer of the Whip system. The labels come from Whip Trend Confirmation, and trend strength comes from Whip Trend Core.
Can I use it on its own?
Yes, to judge volatility, squeezes and stretched price. For entries, it works best with the other two modules.
Do I need to change any settings?
No. The defaults work on every market and timeframe.
Reading the channel
Price touched the upper boundary. Should I sell?
Not on that alone. On the 1H example, price rode the upper boundary all the way to 87,395 on the 21st, which was strength. On the 23rd, price was rejected at the same boundary in a flat channel, which was a warning. The channel's shape and the other two modules tell you which one you are looking at.
Price touched the lower boundary. Should I buy?
Same answer in reverse. On the 1H example, price rode the lower boundary down to near 82,900 on the 23rd to 24th. Buying those touches would have meant fighting the drop. Wait for a BUY on Trend Confirmation and signs of exhaustion on Trend Core.
What is a squeeze?
The channel narrowing to one of its tightest widths in a while. The market is quiet and coiling, and a bigger move often follows. On the 1H example, the squeeze on the 20th came right before the rally to 87,395.
How do I know which way a squeeze will break?
Channel Pro does not tell you. Watch for the channel to start expanding, a close outside a boundary, and a signal on Trend Confirmation in the same direction.
Can a squeeze break the wrong way first?
Yes. On the 4H example, the squeeze on the 13th broke up to near 79,500, then reversed and rode the lower boundary down to the 74,968 low. Do not act on the first poke outside the channel. Wait for the channel to widen in one direction and for the other modules to agree.
What does the center line do?
It is the market's current fair value. Price tends to come back to it after stretching away, and it often acts as support in an uptrend and resistance in a downtrend. On the 1H example, it held as support on the 22nd, and breaking below it on the 23rd was the first sign of the drop.
Price keeps bouncing between both boundaries. What does that mean?
A volatile range with no trend. On the 30m example, price swung between about 83,200 and 85,300 on the 24th to 25th, and every boundary touch reversed. Trend signals are unreliable in that kind of market.
Support and resistance
What do R1 and S1 mean?
R1 is the closest resistance level above price, R2 the next one up, and so on. S1 is the closest support level below price, S2 the next one down.
What does the tag in brackets mean?
The timeframe the level comes from, such as (30m), (1H) or (4H). A combined tag, such as (1H/4H), means more than one timeframe agrees on that level.
Which levels matter most?
Confluence levels (combined tags, drawn thicker and darker) and levels from higher timeframes. A level with many touches, if you switch on the touch count, also tends to be stronger.
What does a dashed level (or [flip]) mean?
Price has recently crossed that level, and the line stops where it crossed. Broken resistance often turns into support, and broken support often turns into resistance, so watch how price reacts if it comes back.
What does a faint level (or *stale) mean?
Price has not reacted to that level for a long time. It may matter less now.
I use TradingView's dark theme and can't see some lines. Resistance levels and the center line are black by default. Change them to a light color in the Colors and Channel Pro settings.
Why don't I see [flip] or *stale on the labels?
Those text tags are off by default. The dashed and faint lines already show the same thing. Switch them on under Label layout if you want them.
Which timeframes should I set the levels to?
Your trading timeframe and the two above it. For example, if you trade 30m, use 30m, 1H and 4H. If you trade 1m, use 5m, 15m and 1H. See the table in Choosing your timeframes.
I switched on a timeframe but its levels do not appear. Why?
It is lower than your chart's timeframe, so it is skipped automatically. For example, 30m levels do not show on a 4H chart.
How do I use the levels for my stop and target?
Place your stop beyond the level you are entering from, not exactly on it. Use the next level in the direction of your trade as the first target, and the one after as the second. Check that the target is far enough away to be worth the risk.
Should I buy every time price touches support?
No. A level only tells you where buyers have stepped in before. Wait for BUY or CONFIRM BUY on Trend Confirmation and Trend Core turning up before treating support as an entry.
Why did the levels change?
The market made new highs or lows, which creates new levels. Levels from a higher timeframe can also adjust until that timeframe's current candle closes.
There are too many lines on my chart. What should I change?
Lower Levels per side to 3 to 5, or set a Max distance filter so only levels near price are shown.
Can I see the levels as a list?
Yes. Switch on Show levels table in the settings to see every level with its timeframe, touches and distance from price.
Using it with the other Whip modules
How do I use all three together?
Trend Core for strength, Trend Confirmation for timing, Channel Pro for location. The more they agree, the stronger the setup.
I have a CONFIRM BUY but price is at the upper boundary. What should I do?
The signal is valid, but price is stretched. You would be buying late. Many traders wait for a pullback toward the center line or size down.
Trend Core is around -10 and price is below the lower boundary. Is it a buy?
The drop is stretched on both measures, so a turn is getting more likely. It is not a buy until Trend Confirmation prints BUY or CONFIRM BUY. Check 1H for the early signal and 4H for the confirmed one.
What is the best setup?
A CONFIRM signal on both 1H and 4H, Trend Core moving strongly in the same direction without being saturated, and price near the center line with the channel starting to widen. Signal, strength and room to run all line up.
Where should I put stops and targets?
The indicator does not place trades for you, but the levels give you clear reference points. Put your stop beyond the support or resistance you are trading from, and target the next level in your direction. The channel's center line and opposite boundary are useful second targets.
Timeframes
Which timeframe should I use?
Use more than one. Decide direction on 4H, confirm on 1H, and use 30m only to time the entry.
Why does a 4H squeeze matter more than a 1H squeeze?
A squeeze on a higher timeframe usually comes before a larger move. A 1H or 30m squeeze can resolve in a few hours.
What does it mean when all three timeframes are squeezing?
The market has gone quiet from short-term to long-term at once. At the right edge of the examples, the channel is about 380 wide on 30m, 520 on 1H and 2,300 and narrowing on 4H. The breakout, when it comes, usually shows on 30m first, then 1H, then 4H.
Technical
Does it repaint?
The channel on the live candle updates as price moves. Once a candle closes, its values are final.
Can I get alerts?
Yes. Set alerts on price crossing the channel lines, and switch on the support and resistance alert to be notified whenever price crosses a shown level. See the Alerts section.
Which markets does it work on?
Crypto, forex, indices, stocks and commodities. The channel adapts to each market on its own.
What is the win rate?
We do not publish one. Results depend on the market, timeframe and how you manage entries, exits and risk.
Access
How do I get access?
It is an invite-only script. Buy access at whipalgo.com, or request access at whipalgo.com/contact.
Do I get the other Whip modules too?
See the plans at whipalgo.com, or ask at whipalgo.com/contact. Each module is its own invite-only script.
Disclaimer and access
Disclaimer. This indicator does not predict future price movement and does not guarantee any result. We are not financial advisors. It is provided for educational and technical analysis purposes only. Use it alongside your own analysis and proper risk management, and never risk money you cannot afford to lose.
Access. Whip Channel Pro is an invite-only script on TradingView. To buy access, go to whipalgo.com. To request access or ask a question, go to whipalgo.com/contact. Once access is granted, find it under Indicators, then the Invite-only scripts tab, and add it to your chart.